Have you ever asked yourself if you’d be able to save time and resources by not spending your already limited resources on assets that don’t need it?
Our guide to Risk-Based Maintenance (RbM) will show you step by step in layman terms how to quickly analyze the most efficient way to use your maintenance resources. The results can include improved reliability, reduced costs, and increased equipment life cycle and integrity.
A study by Aalborg University in Denmark on offshore steel structures outlined how one company was able to save over 80% on total repair costs! We’ll share all the details of how to use this approach at your organization.
What is risk-based maintenance and why is it important?
Risk based maintenance can get pretty robust and complex, but in a nutshell – it helps you determine the most economical use of your maintenance resources. What is the difference between risk-based maintenance and reliability-centered maintenance?
This may sound complicated, but the process can be relatively simple. We will dive into the nuts and bolts of how below, but the gist of corrective Risk-Based Maintenance is to find the critical/problem assets and dedicate your maintenance resources to them while diverting resources from non-critical assets.
When done right the rewards are great. An oil and gas company in Europe was able to save over $15MM yearly utilizing Risk-Based Maintenance.
Mean Time Metrics Calculator
Just getting started with maintenance metrics? Use this helpful calculator with formulas and calculations.
How do you implement risk based maintenance?
With Risk-Based Maintenance, we’re on a mission to analyze two key measurements: prevention (Probability of Failure) and recovery (Consequences of Failure).
To get started, we first need to understand what those two phrases mean:
The Probability of Failure simply means, “what’s the likelihood that this piece of equipment will fail?”
Often Probability of Failure (PoF) correlates with the age (run-time) of the equipment.

However, time should not be your only consideration. Working conditions are important when it comes to decision-making and the Probability of Failure.
Assets located in wet or dusty places may require more upkeep and may be more likely to fail. As you can imagine, things like geography, climate, and other environmental conditions play an important role in determining PoF.
The Consequence of Failure means, “how much will this machine’s failure cost?”
You should consider as many factors as possible in determining the Consequence of Failure (CoF). You’ll want to ask yourself questions like:
- What does the average repair cost?
- How much am I losing each year in downtime (production loss) because of this machine isn’t functioning properly?
- Are there accidents related to this equipment’s failure? Is this machine’s maintenance process slowing down other areas of production?
- Are there safety hazards related to this machine’s maintenance approach or lack of maintenance?
As you can see, there’s more to consider than just repair costs.
Now that we understand the terminology let’s start the process.
1. Collect your maintenance data
Before doing anything else, we need to collect and analyze your current maintenance data. The goal here is to utilize the data on hand to identify problem areas.
You’ll need to get a decent inventory of your assets and what they’re costing you. To do this, refer to your CMMS and other maintenance records. For an in-depth look at what a CMMS is, check out our What is a CMMS System and How Does it work guide.
From those records you will want to know the following for each piece of equipment in your facility:
- How old is this piece of equipment?
- How often is the piece of equipment failing? (MTBF)
- How long does it take to restore the equipment to working order? (MTTR)
- What does it cost when this piece of equipment fails? (Interruption in production, parts cost, labor cost, etc.)
- How often do you perform maintenance on this piece of equipment?
Once you’ve got the data for all of your equipment, you’ll want to pinpoint which assets need your attention.
There are several great methods to do this, but in this post, we will use the Criticality Matrix as an example.
If you are one of the lucky few with a great CMMS it will automatically tell you your problem assets. For example, at Limble CMMS, we’ve created a powerful reporting section where problem assets float to the top of the list, allowing you to see at a glance which asset is costing you the most and why.
2. Visualize with a criticality matrix
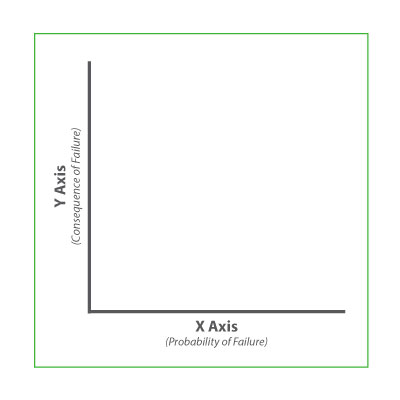
A criticality matrix (this sounds super nerdy and complex, but it isn’t) is simply a graph where the Probability of Failure is plotted on the X-axis (horizontally), and the Consequence of Failure is plotted on the Y-axis (vertically). Like this:

To show you how to create the graph we will break it down a bit with an example.
Let’s say we’ve inventoried the following equipment: Generators 11, 12, and 13.
We’ve looked at the maintenance records for each piece of equipment and have the data needed to determine the PoF and CoF of each.
To graph this, we need to score the Probability of Failure (PoF) of generators 11, 12, and 13 by assigning a score representing the likelihood that each generator might fail.
The score range might look something like this:
1 = highly unlikely failure will occur within three years
2 = unlikely failure will occur within three years
3 = failure is not likely or unlikely
4 = failure is likely
5 = failure is highly likely
TIP#1: You can use any type of scoring system you’d like. If it’s easier for you to think of percentages (i.e. 10% chance of failure, 20% chance of failure, etc.) then, by all means, go for it!
Now that we have our scoring framework set up, let’s do the scoring.
Our data tells us that in the last 3 years Generator 11 broke down 5 times, Generator 12 broke down 2 times, and Generator 13 broke down 3 times. Based on these numbers, let’s give the following scores:
Probability of Failure Scale
Generator 11 – score of 5
Generator 12 – score of 2
Generator 13 – score of 3
Next, it’s time to assign each generator a Consequence of Failure score. Again, we need to create a scoring system that represents the level of consequence for each asset. (You can also score your CoF in any way that you’d like).
Let’s measure the failure impact:
Generator 11 – This generator is used by the mobile night crew to provide electricity for lighting. If it breaks, the crew cannot continue their work, which costs $5,000 in wasted time, labor project delays, etc. Repair costs are normally $300 per breakdown.
Generator 12 – This is an old generator that rarely gets used. This generator’s failure doesn’t have a huge impact. Repair work, wasted time, labor, etc. costs only $500. Repair costs are normally $300 per breakdown.
Generator 13 – This machine is used for random work out in the yard. Random work out in the yard isn’t urgent, but it does cost money when it can’t be completed. The estimated loss in wasted time, labor, etc. is $2,500. Repair costs are normally $200 per breakdown.
Consequence of Failure Scale
1 = Less than $2,500 yearly costs
2 = Between $2,500 and $5,000 yearly costs
3 = More than $5,000 yearly costs
And then, we’d assign each generator a score based on the particular consequences (costs) of each machine. Like so:
Generator 11 = 3
Generator 12 = 1
Generator 13 = 2
TIP#2: The best way to figure out the Consequence of Failure is to go talk with your team. Ask them what happens if a particular piece of equipment doesn’t work and what that costs them. Look at your CMMS or maintenance records to see what repair costs. These actions will give you great insights into the true cost of equipment failure.
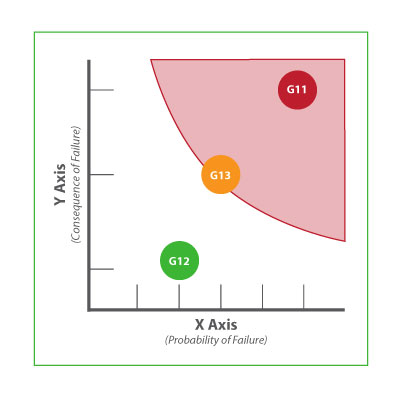
Now that we have the Probability of Failure and Consequence of Failure scores, it’s time to plot our data. This graph would look something like this:

The generators that are bordering or are inside the red area (numbers 11 and 13) have a much higher risk level than the equipment towards the bottom-left of the graph (number 12). In this case, we might consider new maintenance strategies for generators 11 and 13.
This is an extremely simple version of a Criticality Matrix as we’ve only plotted a few assets and we kept our PoF and CoF scoring very basic. But, you’ve still got a great view of which assets would benefit most from a maintenance plan. The more assets, the more beneficial this graph would be in quickly selecting assets for maintenance programs.
The Essential Guide to CMMS
The Essential Guide to CMMS

How do you know which type of maintenance to implement?
Now that you know which assets require maintenance plans, how do you go about choosing the right plan for each machine?
We hate to break it to you but there is no pre-determined, standard strategy that will automatically work best for your company. Each facility is different, filled with different equipment, making different products, with different humans operating the equipment.
That being said here are a few questions that you will find helpful when determining which maintenance strategies to implement.
How much and what are my maintenance resources?
Sadly, in the maintenance world, you’re expected to do more every year with an ever-shrinking resource pool. In a perfect world, your maintenance staff would be large enough to get the job done right, but that is rarely the case. When considering maintenance strategies, you need to consider resources.
For example, a preventative maintenance plan will do little good if you do not have the manpower to perform the PMs when they are scheduled.
What does the manufacturer recommend?
The manufacturer should be your go-to source of information. Often, an equipment manual will provide a detailed outline of what work needs to be done to keep it properly maintained. That being said, keep in mind that these are general guidelines, and, depending on your situation, you may want to increase or decrease the frequency.
What does each asset cost to replace and what is its expected remaining life?
In situations with very old assets that have a short remaining life, you might find it best to run the asset to failure, and then purchase a replacement. This may not be true if the asset has a very high CoF, but luckily you now know how to find this answer 🙂
Where did it land in your Criticality Matrix?
If an asset landed in the top right corner (super risky area) of your matrix, then you need SOME kind of strategy in place. You can assign routine inspections or implement a predictive maintenance plan that will allow you to only repair the equipment when it absolutely must be repaired.
Before you make any big decisions, make sure to know all of your options. Check out our in-depth comparison of maintenance strategies to learn the pros and cons of each approach.
Reduce the risk by starting small, then scale
Once you’ve identified which maintenance methods might work for your assets, you can increase your chances of succeeding by starting small. That is, put your plan into action with just a few pieces of equipment to start. Monitor progress and scale your strategy from there if it proves successful.
If you’ve decided to implement a maintenance plan, then you should consider investing in a CMMS solution (if you don’t have one or are using an old and outdated package).
With Limble CMMS, you can streamline your workflow, gather quality data, and quickly make key decisions to optimize your company’s production from the palm of your hand.