Overall Operations Effectiveness (OOE)
Overall Operations Effectiveness (OOE) calculations provide insights into the performance of assets and systems, taking into account performance, quality, and availability.
What is overall operations effectiveness?
Calculating Overall Operations Effectiveness (OOE) is a method for assessing the performance of production lines. Though the two are easily confused, it is distinct from the more common KPI Overall Equipment Effectiveness (OEE).
Tracking OOE and other metrics on an ongoing basis is an important part of managing Total Preventive Maintenance and promoting continuous improvement. Close attention to these figures leads to better decision making, reduced costs, and improvements to operational efficiency.
Overall Operations Effectiveness vs. Overall Equipment Effectiveness
OEE and OOE look similar and they’re often calculated together to assess production processes. Their differences lie in how they define maximum availability.
OEE calculations do not factor in unscheduled time. When you calculate OOE, however, you broaden your focus and take into account all potentially productive time. If your plant is operational, the time counts toward your OOE value. Planned downtime, changeover, training, and other stoppages will ultimately affect the total number.
Total Effective Equipment Performance (TEEP)
Calculating TEEP is a way of measuring manufacturing productivity that takes all available production time into account. Whereas OEE looks at scheduled and planned production time alone and OOE looks at total operating time, TEEP assesses performance against a 24/7/365 calendar.
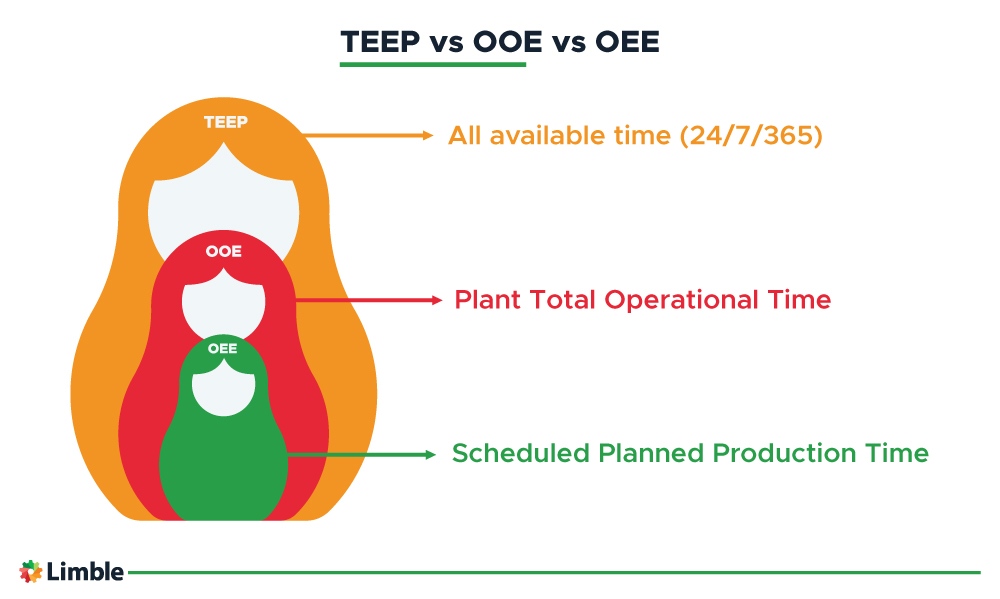
This graphic illustrates the relationship between OEE, OOE, and TEEP.
Calculating OOE
OOE = Performance x Quality x Availability (Total Operational Time / Uptime)
You can calculate OEE by multiplying your performance score against your quality rate and your equipment’s availability. In this context, you’ll calculate availability by dividing total operational time by the actual amount of time your assets spend in production.
If you were calculating OEE instead, you’d follow the same formula while determining availability by looking at your planned and scheduled production time alone.
The ideal OOE score will vary from organization to organization. Internal benchmarks or industry standards could help set your definition of world-class performance.
The 3 factors that affect OOE
To better understand OOE, let’s take a closer look at the metrics that contribute to it. You’ll need a formula for calculating each of these if you want an accurate OOE number.
Performance
Maintenance teams score an asset’s performance with a percentage. This represents its ability to fulfill its full performance potential. A machine that maintains peak performance throughout its production cycles would have a performance score of 100%.
Performance = (Actual Production Time / Ideal Production Time) x 100
Quality
Your quality rate is also expressed with a percentage. It tells you how many of the products you’ve produced over a given period were good quality products. Products featuring defects or requiring rework do not qualify as good.
Quality = (Good Products Produced / Total Products Produced) x 100
Availability
In the context of OOE, availability is measured against total production time. You should not factor out planned stoppages like those for scheduled maintenance tasks when calculating OOE. Like the other two metrics, it is expressed as a percentage.
Availability = (Total Operating Time / Actual Production Time) x 100
The six big losses in manufacturing processes
Calculating and improving on your OOE and OEE scores helps to address the six big losses that contribute to waste and inefficiency in manufacturing.
These losses fit into two categories that coincide with the factors affecting OOE and OEE values.
- Availability losses: Equipment failure and setup & adjustments
- Performance losses: Idling & minor stops and reduced speed
- Quality losses: Production scrap and startup scrap
Availability losses in manufacturing
- Equipment failure: Unplanned downtime from breakdowns and other incidents can leave your team scrambling to take corrective action while cycle times drag on and the costs pile up.
- Setup & adjustments: There is no escaping most planned downtime, but the right approach can mitigate the impact of these production pauses.
Performance losses in manufacturing
- Idling & minor stops: For large-scale production processes even short stops can have a big impact. Real-time monitoring can enable autonomous maintenance to address problems on the spot.
- Reduced speed: Issues like wear and tear, equipment misuse, and poor maintenance processes can all reduce speed and keep your production line from its ideal cycle time.
Quality losses in manufacturing
- Product scrap: Both human error and equipment breakdowns can contribute to process defects and scrapped products. Keeping a close eye on equipment performance and training operators well can help.
- Startup scrap: When you introduce a new piece of equipment to your production line, you may be excited to see it in action. It’s important to remember that it may take some time for newly implemented assets to dependably meet your quality standards. Stick with small batches at first to avoid significant quality losses.
Some benefits of tracking and improving OOE
Programs for measuring and improving upon OOE figures offer many benefits to manufacturers.
- Efficiency improvements: Taking a holistic approach to assessing production lines and business assets helps draw attention to potential sources of waste.
- Productivity boosts: By using their resources as effectively as possible, manufacturers can produce more without putting additional strain on their teams.
- Better decision making: Enhanced visibility and a wealth of historical data empower more strategic decision making to outpace competitors and enable ongoing improvement.
- More sustainable operations: Reducing wasted resources and expediting production processes can help serve your organization’s sustainability goals.
Want to see Limble in action? Get started for free today!
Best practices for improving OOE
Challenges such as insufficient access to data, significant up-front investments, and internal resistance can complicate OOE calculations. These best practices can help manufacturers avoid common roadblocks and
- Emphasize the importance of communication: Improving on OOE or any maintenance KPI requires collaboration and communication. Whatever their role on the team, everyone should fully understand the organization’s mission and the importance of OOE.
- Prioritize training and development: The right materials and programs for training your maintenance team ensure that everyone is prepared to carry out monitoring and maintenance processes with speed and efficiency.
- Implement a CMMS: A Computerized Maintenance Management System (CMMS) like Limble automates and simplifies key processes while providing access to a wealth of historical data. Learn more in our guide to everything CMMS.
The Essential Guide to CMMS
Download this helpful guide to everything a CMMS has to offer.

FAQ
Why use CMMS software to track maintenance metrics?
Using CMMS software simplifies tracking complex maintenance metrics, fosters data-driven decisions, enhancing efficiency, reducing downtime, and aiding in regulatory compliance all in one.
Is Limble Mobile CMMS app user friendly?
Limble is consistently rated Easiest-to-Use CMMS on review sites like G2, Capterra, and Software Advice. And our customers agree. With our mobile CMMS app, teams experience 30%+ better productivity, on average, requiring little to no training or ramp-up time. Our CMMS app can travel with your team, no matter where they go! Visit our App Store or Google Play for more information.
Can I connect to other systems?
Limble provides seamless, pre-built CMMS Integrations with the most widely used software systems. That means no help from a developer or your IT team is required. Learn more about our integrations.
How secure is the Limble CMMS platform?
At Limble, our world-class data security practices ensure your account information is safe. We use state-of-the-art technologies and industry best practices to maintain a secure infrastructure, including SOC-II Type II certification, regular penetration testing, and continuous security training for our staff.


-Concept-Explained")