Businesses that rely on machinery to create revenue lose money when the machinery is idle. Yet, many operations do not have insight into the efficiency of their equipment and lack understanding of the causes for unplanned stoppages.
Downtime tracking is an important tool for businesses seeking to maximize production efficiency. Yet, collecting data to show the machine has stopped is simply one step in the process. The next steps include allocating cause, aggregating the data, and applying remedial tactics to prevent or reduce future occurrences.
In this article, we’ll present how to collect, analyze, and use machine data to improve equipment uptime and gain competitive edge.
Benefits and purpose of tracking machine downtime
We’ve mentioned the financial cost of machinery being idle. Reducing downtime increases your production and revenue while labor costs remain the same, decreasing your labor cost per unit produced. That flows through to a greater profit margin or a lower price to your client.
A self-reported survey carried out by Aberdeen Research found that unplanned downtime can cost up to $8,600 per hour. If these figures are representative, losing one hour of production per week equals over $400,000 lost in annual revenue.
Finances aside, there are other, less obvious impacts. You may lose customer trust if production deadlines are missed or if product quality fluctuates due to intermittent production.
A common theme from operations that implemented downtime tracking is the disparity between what they thought their productivity was and what the tracking revealed. You can’t fix it until you can identify and measure it.
Once the data is aggregated and categorized, you can test tactical mitigations against further stoppages for their effectiveness and impact on overall equipment efficiency (OEE).
Examples of such interventions include:
- Scheduling additional operator training to enhance understanding of the equipment and upskilling them so they can take on more ownership and responsibilities.
- Adjusting maintenance strategies targeting the identified causes of poor reliability.
- Modifying processes for reducing tool changeover or adjustment times.
- Modifying existing tools and equipment (or purchasing new ones) to reduce stoppage times.
- Improving staff scheduling to reduce delays from operator unavailability.
CMMS Buyer's Guide
Learn the questions to ask and the features to look for during the CMMS selection process - and find the right CMMS for you.

The difference between equipment downtime and production downtime
The terms equipment downtime and production downtime are sometimes used interchangeably and can be confusing. For this article, we’ll refer to production downtime as planned stoppages – while equipment downtime is considered unplanned.
By this definition, equipment downtime is negative performance against the plan. Take an example of a planned stoppage for maintenance. If one hour was planned, but the maintenance took two, we have one hour of equipment downtime. If inventory delays impact a tool changeover, that excess time also needs to be captured. Similarly, equipment failure, breakdowns and operator errors go against equipment downtime.
Tracking and analyzing this differential between planned and actual downtime identifies root causes and helps you plan out future improvements in equipment effectiveness. On top of that, it also helps you define efficiency metrics and KPIs which can be used to measure overall equipment effectiveness, as well as the performance of your production and maintenance teams.
Collecting meaningful machine downtime data
Data for its own sake is meaningless. If you learn that in the past 24-hours, production was down for an hour, what does that tell you? Trying to quiz operators on stoppages after the plant floor event will yield partial information, subjective recall, and the possibility of incorrect information to hide an operator error – to protect a colleague.
Actionable data requires a degree of granularity. Your collection methods should identify all the two, five, or ten-minute stoppages that total considerable lost production throughout the shift. Create categories of events that staff must apply to each period of downtime before restarting equipment. This forced ranking system allows data to be aggregated by category, with Pareto charts identifying areas of opportunity for analysis and improvement.
![]()
Reporting downtime in the form of a Pareto chart. Source: Scytec
Your “categories” might look something like this:
- Excessive tool changeover
- Machine problems
- Tool adjustment required
- Setup delays
- No operator available
- Unplanned maintenance
- …
Additional data you should try to capture includes:
- Which machine the downtime is raised on
- Who was on shift either running or maintaining the machine
- Who is raising the report
Last but not least, it is always good to have a clear differentiation between planned downtime and exceedances to that plan.
Methods of data collection for machine downtime tracking
The method you use to collect machine data is important for tracking downtime rigorously, with data integrity crucial to achieving an accurate analysis based on precise, timely, and actionable insights.
Manual data collection
Historically, tracking downtime was a manual process: operators or maintainers would write longhand into equipment logs to track downtime.
As you can imagine, collecting downtime data this way comes with considerable difficulties:
- Unreported downtime periods
- Partial entries missing useful downtime data
- Stated reasons for stoppages do not reflect the actual root cause of equipment downtime
But wait, there’s more. Manual data collection takes time and what is captured is often not standardized or contextual. Such uncontextualized data is difficult to chart and analyze, creating skewed information and leading to incorrect conclusions.
Luckily, there is a better way.
Automated data collection
The automation of data collection via machine monitoring addresses many of the problems encountered with manual methods.
Using software linked to a machine’s control system guarantees that accurate start and stop times are tracked automatically for all downtime events. Some systems even prevent restarting until operators enter reasons for the downtime, and the choice of reasons is limited to a standardized list to provide contextualized information.
![]()
An example of machine downtime report. Source: Ocean Data Systems
The choice of automated data collection methods depends largely on an organization’s complexity and size. Commonly used downtime tracking systems include:
- An organization-wide integrated management system (IMS)
- Manufacturing execution systems (MES)
- Computerized maintenance management systems (CMMS)
- Specialized downtime tracking software connected to a machine’s PLC
- Machine data loggers with weekly data dumps
However, to record downtime, organizations that implement automated downtime tracking are not restricted to one data collection method or a single downtime tracking software. Many of the options listed above are capable of interconnection, providing scalability for small businesses while allowing larger organizations proof-of-concept trials.
An example would be using a data logger with a CMMS or MES. While the data would not be available in real-time, batched weekly uploads with total downtime allow a low-cost way of identifying potential productivity issues on critical machines.
Using Limble CMMS as your downtime tracking software
One way to automate data collection process is by feeding machine operational data into a CMMS software. The CMMS can then provide an up-to-date review of machine downtime, with data aggregated and ranked, offering the option to create Pareto charts and standardized reports.
You may already have sensors installed and connected to CMMS for running condition-based maintenance. The principle is very similar.
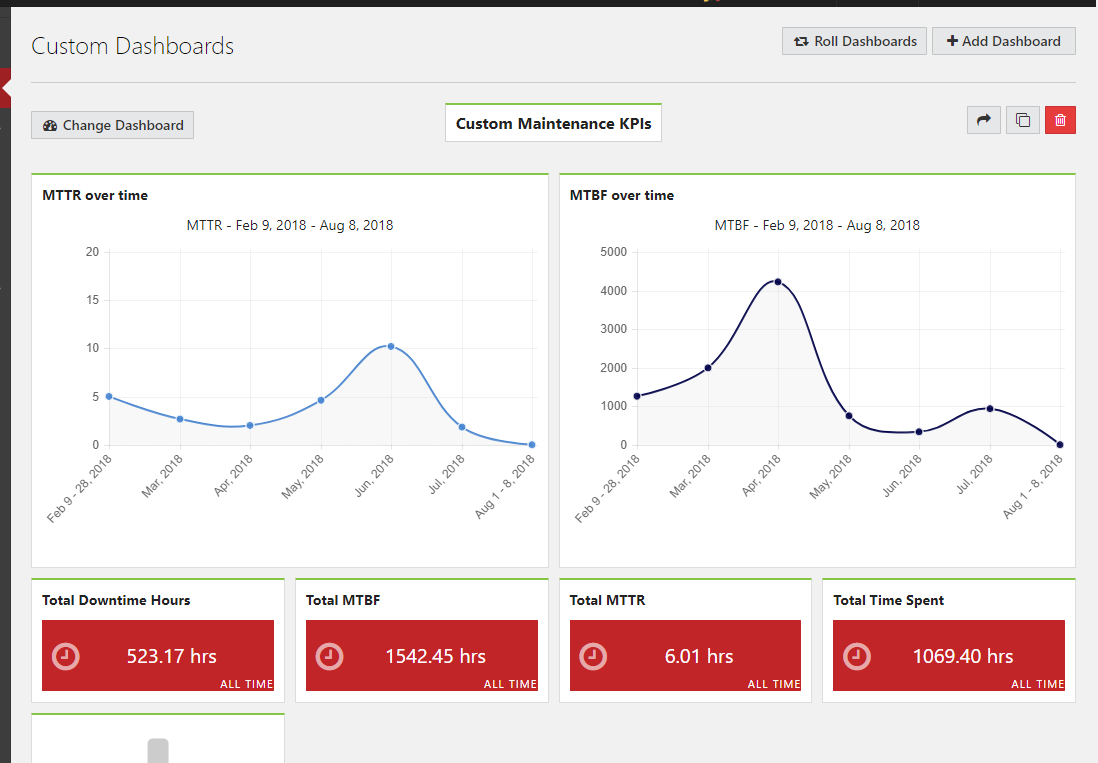
Limble CMMS, for instance, can use those inputs to automatically calculate mean time between failure (MTBF) and mean time to repair (MTTR), and inform your OEE calculations.

Limble CMMS automatically generates MTTR and MTBF metrics
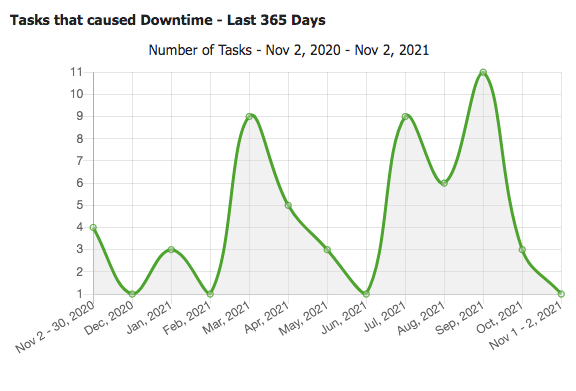
Additionally, Limble gives you a real-time view of all the maintenance tasks that are scheduled and completed — including ones that cause downtime. This lets you see what’s happening with all your physical assets and determine places for improving efficiency.

Limble helps you track tasks that caused downtime
Using automated data capture with predefined categories aids objectivity and transparency. It also assists in problem analysis, the development and implementation of remedial actions, and the review of the efficacy of such actions.
TL;DR: Not using a CMMS or other downtime tracking software is a lost opportunity. Watch this video to see how one of our customers was also able to take his downtime rate from 26% to 4% using the data that came from Limble.
There is no optimization without data
Downtime tracking is a data collection process that offers businesses a considerable return for minimal investment. Most companies underestimate their true machinery downtime and fail to calculate accurate downtime costs. For manufacturers, unplanned stoppages are one of the greatest losses of production capability, causing financial penalties and lost opportunity.
Implementing a downtime tracking system linked to a CMMS improves the ability to gain insights into the operational causes of stoppages, improved production and reliability metrics, and improved equipment OEE from targeted remedial actions.
To learn more about Limble CMMS and its ability to optimize your production and maintenance processes, reach out via email or schedule a personalized walkthrough.