Conducting a root cause analysis (RCA) helps trace recurring problems to their source. It begins with identifying a problem. Next, data collection helps you to pinpoint the root cause and take corrective action.
In healthcare, RCA ensures that doctors address the underlying causes of conditions instead of wasting their time on symptoms alone. The same principle applies in manufacturing, facilities maintenance, and any other industry.
Businesses conduct RCA to find the causal factors behind their problems and eliminate them. Ultimately, RCA enables proactive maintenance and asset management. Instead of correcting issues after they occur, you’ll stop them from happening in the first place.
How to conduct an effective root cause analysis in 4 steps
You can conduct root cause analysis with the help of a range of different tools and techniques. Though these processes may look different, they all share a common goal: fixing the root cause of an issue.
To do a root cause analysis the right way, you should follow four basic steps:
- Define the problem
- Collect data
- Map out the events to identify root causes
- Implement solutions to solve the problem
Step 1: Define the problem
By defining the problem, its symptoms, and its consequences, you’ll set the scope and direction of the analysis.
Without a specific problem statement, you’ll struggle to create a path to a solution. A well-defined problem statement also helps determine the scale and scope of the solution you’ll ultimately implement. When you’re writing your problem statement, keep these three questions in mind:
- How would you describe the problem at hand?
- What do you see happening?
- What are the specific symptoms?
Step 2: Collect the data
Next, gather data related to your problem or incident. Record anything that might help you get to the source of your organization’s trouble.
Take, for example, a machine failure in a manufacturing plant. You’ll want to track data like:
- The age of your equipment
- Your equipment’s operational time
- Your equipment’s operating patterns
- The typical maintenance schedule
- Characteristics of the operating environment
- The names of the operators who typically handle the machine
- The technical specifications of the machine
Inspecting the machine in person provides plenty of information that could serve your root cause analysis. Facilities that run predictive maintenance need to take particular care to collate their data quickly.
Step 3: Map out the events
Then, establish a timeline of events. This will help you determine which factors among the data collected are most worth investigating. Putting events and data in chronological order helps to differentiate causal factors from non-causal factors.
From the data collected, you can identify correlations between various events, their timing, and other data collected. Remember that correlation does not mean causation.
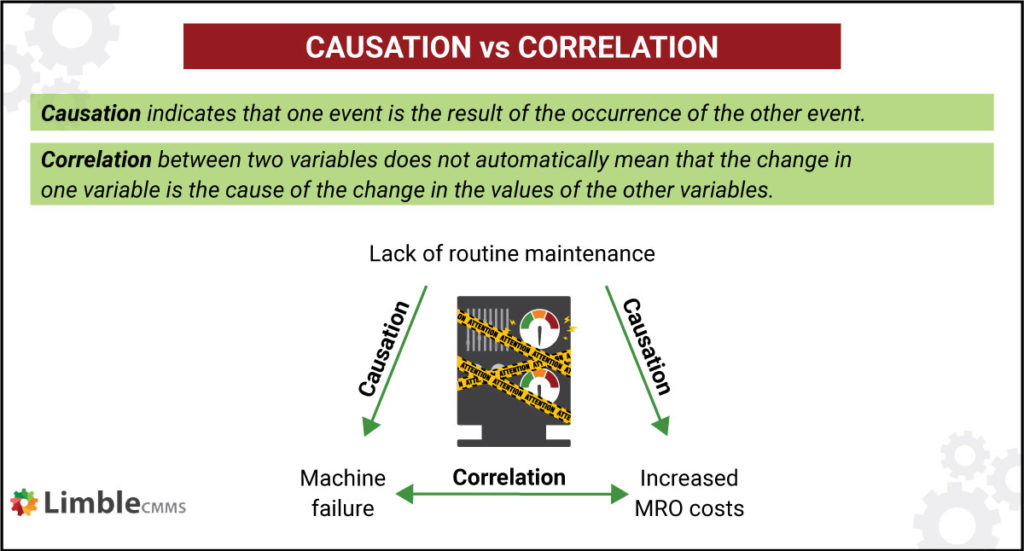
Here’s the difference between causation and correlation in a maintenance context.
Questions to ask yourself when looking for correlations:
- What sequence of events allowed this to happen?
- What conditions allowed this to happen?
- What additional problems result from the main problem?
The next step is to employ additional root cause analysis tools to identify potential causes.
For example, you might map out events with the help of a causal graph. These graphs represent the relationship between the events that happened and the data you’ve collected. The different paths are given different probability weights. They can serve as a visual tool to track down the root cause.
Step 4: Address the root of the problem
Once you’ve identified the root cause, you can quickly determine the best solution to fix it. Map the solution against the scope defined in your initial problem statement. Do you have the resources you need? If so, it’s time to implement a solution.
Once the problem is solved, you will need to take preventive steps to ensure it doesn’t happen again. If the symptoms occur again, it’s time to return to the drawing board and conduct RCA again.
The 3 Rs of Performing Root Cause Analysis
Another simple way of understanding root cause analysis focuses on the 3 Rs of RCA: recognize, rectify, replicate.
- Recognize: Taking corrective action begins with identifying the problem. With a detailed problem statement, you’ll have a dependable procedure for digging into the issue and finding the root cause.
- Rectify: Once you’ve identified the root cause, you can take measures to ensure it doesn’t happen again. If it reappears, you may have addressed symptoms alone.
- Replicate: Attempting to recreate a problem helps you test whether you actually fixed the root issue. You might also try to replicate the conditions that led to a positive outcome.
Root cause analysis tools and techniques
There are many tried and trusted frameworks for executing RCA. Some offer a better fit for certain industries than for others or help to address specific types of problems.
Your company should establish its own unique methodology for conducting RCA and always tailor its approach to the issue at hand. In some instances, you might bring in external consultants to guide your efforts or even execute the analysis.
Let’s look at some of the different forms of root cause analyses.
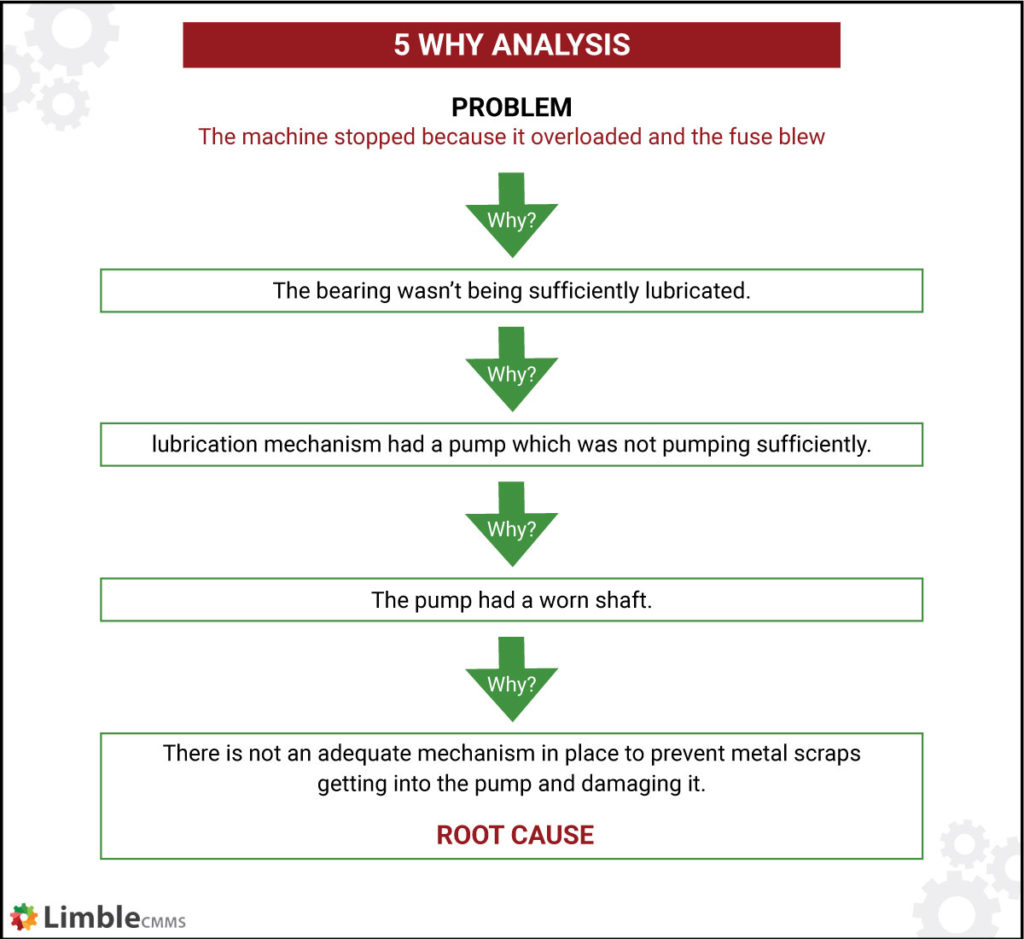
5 Why analysis
The 5 Whys technique for root cause analysis and problem solving was developed by Sakichi Toyoda. It is at the heart of the Toyota Motor Company’s lean manufacturing processes.
Simply put, the process involves asking ‘why’ over and over again until you’ve reached the root cause of a problem. The goal is to ask why until you can’t anymore.
A rule of thumb holds that 5 ‘whys’ is usually enough.
Asking ‘why’ brings businesses closer to the root cause of their problems.
Benefits of 5 Why analysis:
- Quickly identifies the root cause of a problem
- Illustrates how one process can cause a chain of problems
- Helps determine the relationship between different root causes
- No need for complicated evaluation techniques
When to use the 5 Whys:
- For simple to moderately complex problems
- When human error has contributed to your problems
Fishbone diagram (a.k.a. Ishikawa diagram)
The Ishikawa method for root cause analysis emerged from quality control techniques employed in the Japanese shipbuilding industry by Kaoru Ishikawa. It results in a fishbone diagram (named for its resemblance to a fish skeleton) that explores the various potential causes of one key problem.
Typical fishbone diagrams break causes into six categories, the six Ms:
- Manpower (personnel)
- Machines
- Measurement
- Methods
- Materials
- Mother nature (environment)
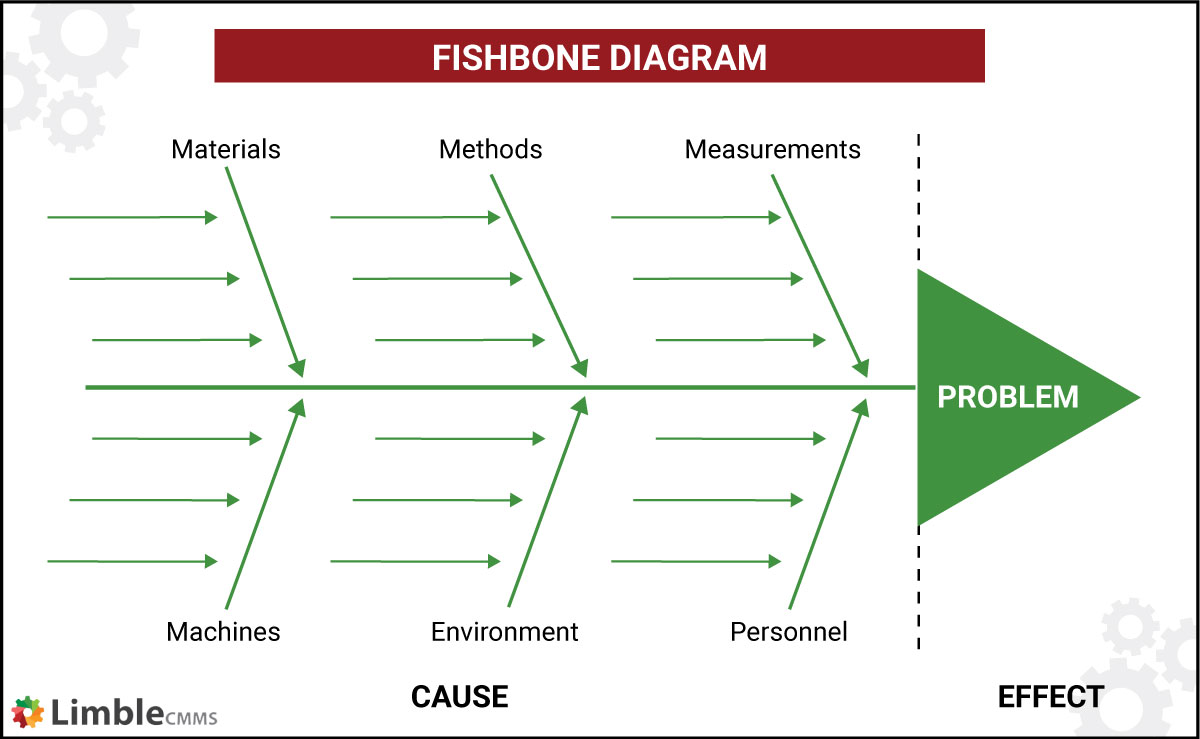
An Ishikawa diagram (also known as a fishbone diagram) outlines the various causes of a key business problem.
Teams explore potential contributing factors until they identify the root cause of the problem.
Benefits of fishbone diagrams:
- Provides a useful structure to guide brainstorming
- Identifies potential bottlenecks
- Explores the full scope of potential causes
When to use a fishbone diagram:
- to analyze a complex problem with many potential causes
- to identify bottlenecks and obstacles to process flow
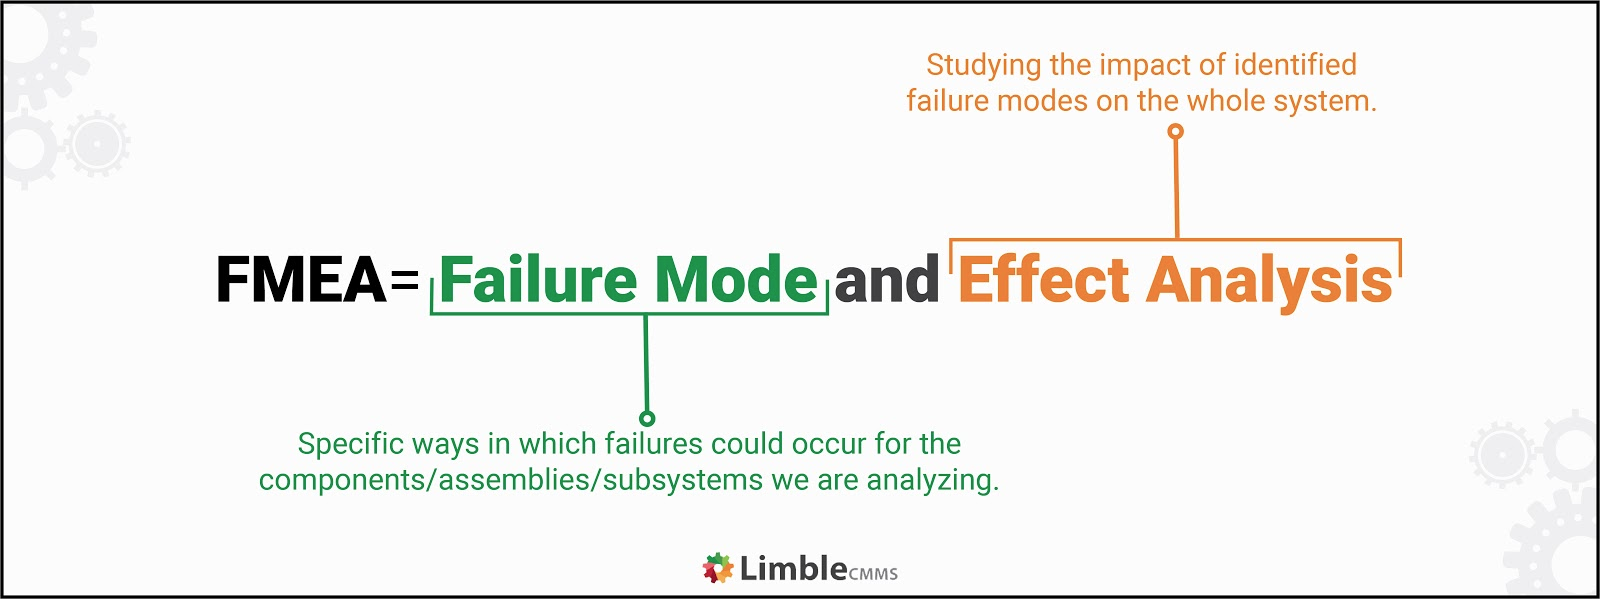
Failure mode and effects analysis (FMEA)
FMEA is a proactive approach to root cause analysis, preventing potential machine or system failures. It combines reliability engineering, safety engineering, and quality control efforts. The process involves predicting future failures and defects by analyzing data.
A diverse, cross-functional team is essential for performing effective FMEA. Make sure to clearly define and communicate the scope of the analysis to your team members.
Your team will closely review each subsystem, design, and process to better understand their purposes and functions. Next, the seam should brainstorm potential failure modes based on data and past experiences.
Then, the team can calculate the risk priority number (RPN) for each potential failure mode. The formula below shows how the severity, likelihood, and detectability of potential causes contribute to its RPN.
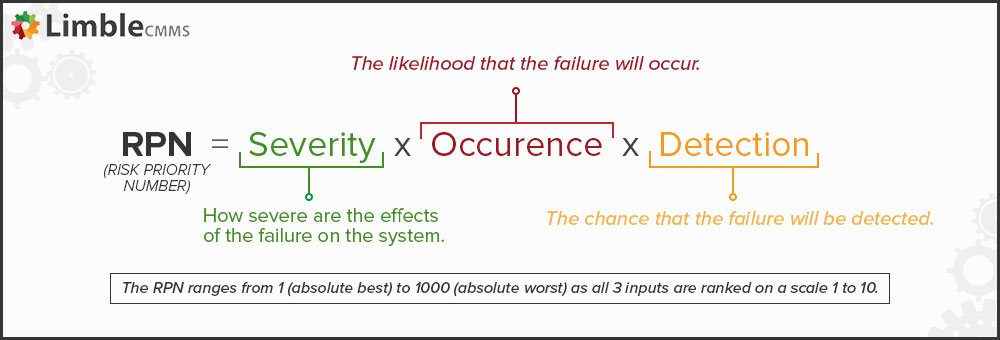
If the failure mode has a higher RPN than you’re comfortable with, you can begin planning out corrective actions.
Benefits of FMEA:
- Enables your team to identify failure points early
- Takes advantage of your team’s collective knowledge
- Improves the quality, reliability, and safety of corrective actions
- Introduces a logical, structured approach for identifying process areas of concern
- Documents and tracks risk reduction activities
When to use the FMEA methodologies:
- When you’re designing new products, business processes, or service offerings (DFMEA)
- When you have a plan for quality improvement
- When you need to understand the failures in a business process and improve upon them (PFMEA)
Fault tree analysis (FTA)
Fault tree analysis is an RCA process that uses boolean logic to identify the cause of a fault or failure.The process involves mapping the logical relationships between faults and the subsystems of a machine.
You first place the failure you’re analyzing at the top of the chart. If two causes have a logical or combination causing effect, they are combined with a logical or operator. For example, if a machine can fail while in operation or while under maintenance, it is a logical or relationship.
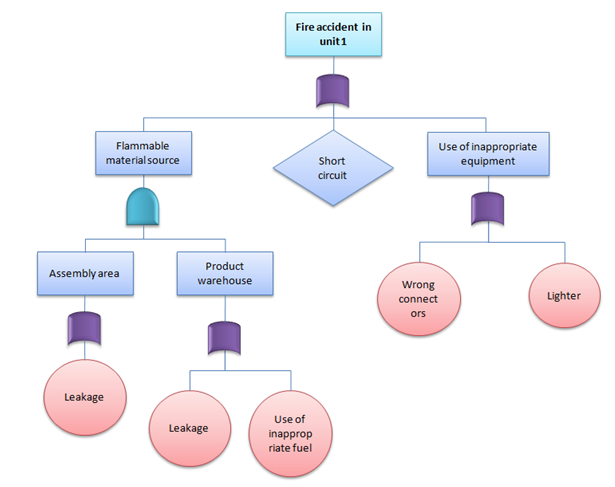
An example of a fault tree analysis Source: Six Sigma Study Guide
If two causes need to occur simultaneously for the fault to happen, the situation is represented with a logical and. For example, if a machine only fails when the operator pushes the wrong button and relay fails to activate, it is a logical and relationship.
Your team can then analyze the fault tree to identify process improvements and risk management opportunities. It’s an especially effective tool for analyzing automated machines and systems. In the above example, and is in blue and or is in purple.
Benefits of using a fault tree analysis:
- Deduces the cause of events
- Highlights the critical elements related to system failure
- Creates a visual representation to simplify failure analysis
- Accounts for human error
- Promotes effective communication between team members
When to use a fault tree analysis:
- When you need to determined if a combination of contributing factors is causing a problem
- When you are designing a solution and need to identify potential sources of failure to make the solution more robust
To find issues that can cause fault-tolerant systems to experience total failure
Pareto charts
A Pareto chart indicates the frequency of defects and their cumulative effects. Italian economist Vilfredo Pareto recognized a common theme across all the frequency distributions he could observe. He noticed a vast imbalance between the ratio of failures and the effects caused by them.
In any system, he proposed that 80% of the results (or failures) are caused by 20% of all potential causes. This concept is known as the Pareto principle or the 80-20 rule.
With the 80-20 principle in mind, you can use Pareto analysis to dig into failures and their possible causes. To start, draw a bar graph that includes the frequency of faults and causes. This graph will make it much easier to see the skewed relationship between causes and effects.
Next, you’ll analyze the causes that contribute to the largest number of faults and take corrective action to eliminate the most common defects.
Benefits of using pareto charts:
- Defects are ranked in order of severity, making it simple to organize priorities
- Helps cumulative the cumulative impact of defects
When to use a pareto chart:
- To narrow down a list of problems and find the most significant
- To analyze a problem with a broad list of causes and identify specific components
More root cause analysis methods and tools
The root cause analysis process looks different for different organizations and varies based on the problem you’re addressing. Here are some additional approaches:
- Cause and effect diagrams try to map the relationship between causes and effects in a system.
- Barrier analysis is an RCA technique commonly used for safety incidents. It is based on the idea that a barrier between personnel and potential hazards can prevent most safety incidents.
- Change analysis is used when a potential incident occurs due to a single element or factor change.
- A scatter diagram is a statistical tool that plots the relationship between two data points in a two-dimensional chart.
Get started with maintenance management software
If you’re feeling overwhelmed, don’t worry. Whether you’re conducting a root cause analysis for the first time or looking to refine your existing processes, Limble’s computerized maintenance management solution (CMMS) can help. By enabling maintenance teams to say goodbye to pen, paper, and spreadsheets, it simplifies every aspect of asset management.
If you want to learn more about how Limble could make your job less stressful, get started with a free trial or set up a demo today.
Download our Free CMMS Buyer's Guide!
Learn the questions to ask and the features to look for during the CMMS selection process - and find the right CMMS for you.


Is there a list of RCA examples for IT environment such as Application, Database, Server, Network Device, Network. Also, please recommend insightful RCA resources for IT
Hey Kenny, I do not know any from the top of my head. Most guides we come across while writing this piece, even when they were for specific industries, still just focused on explaining the general concept.
I would have to google it the same as yourself. Good luck with the search!
These tools are not easy to use, espicallly in complex problems, but explanation is good.
Comments are closed.