Total Effective Equipment Performance (TEEP)
Everything you ever needed to know about TEEP.
What is TEEP?
Total Effective Equipment Performance (TEEP) is a core measure of manufacturing productivity that takes all available productive time into account. It can be a very useful metric to support strategic decision-making by high-level management seeking to improve operational efficiency.
How does TEEP compare to other performance metrics?
TEEP is one of three key metrics organizations use to work toward improvement in manufacturing — the other two being Overall Equipment Effectiveness (OEE) and Overall Operations Effectiveness (OOE).
All of them are calculated by multiplying the same three factors: availability, performance, and quality. The only difference lies in how they define the variable of “availability.”
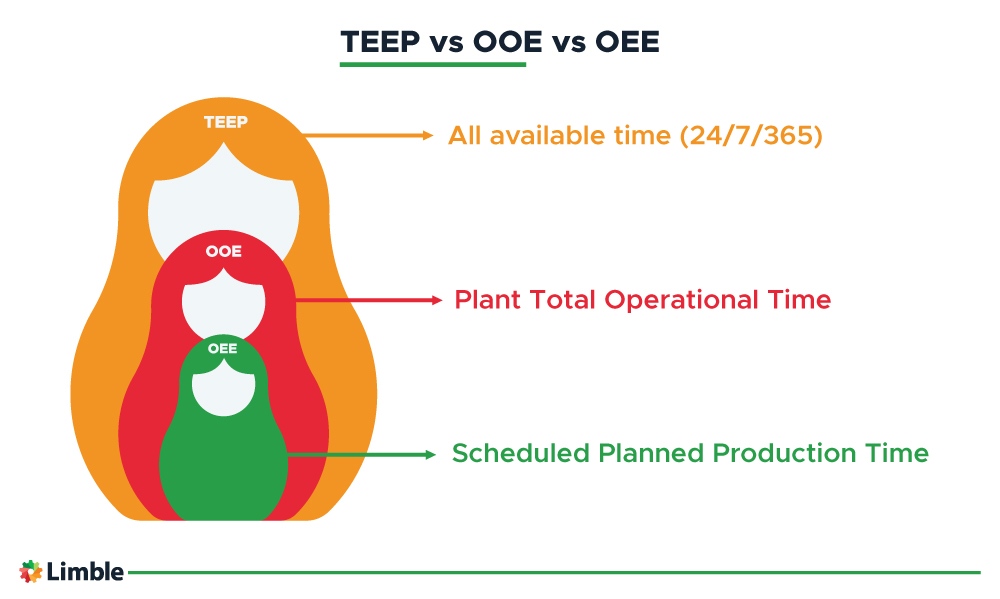
You can think of the three metrics as babushka dolls, where opening one doll reveals another inside it.
TEEP is the outermost doll, providing strategic insight into the most efficient use of plant assets to support strategy formulation. OOE is the next layer and is a tactical metric that measures plant efficiency against the planned operational time. OEE is at the center as a pure measure of operational performance against equipment availability.
Let’s take a quick look at each of them separately to understand how they are interrelated and what each one can tell you about your plant’s performance.
Overall Equipment Effectiveness (OEE)
OEE indicates the percentage of time during which a machine is operating correctly, compared to its scheduled availability.
A key differentiator of OEE is that it only includes breakdowns and planned stoppages that impact production performance. It does not consider times when the machine is out of operation for other reasons, such as planned maintenance, management calling a stoppage for training, or workers holding a union meeting.
OEE is a pure measure of operational effectiveness, using true production availability as a baseline.
Overall Operations Effectiveness (OOE)
OOE has a slightly wider focus than OEE.
For OOE, if someone takes the equipment out of operation for any reason (planned or unplanned), it will impact the operational performance. Considering the previous examples of planned maintenance, training sessions, or union meetings, all of them will impact the performance component of OOE.
OOE is a tactical metric that measures operating performance against the total time the equipment was scheduled as available to operate.
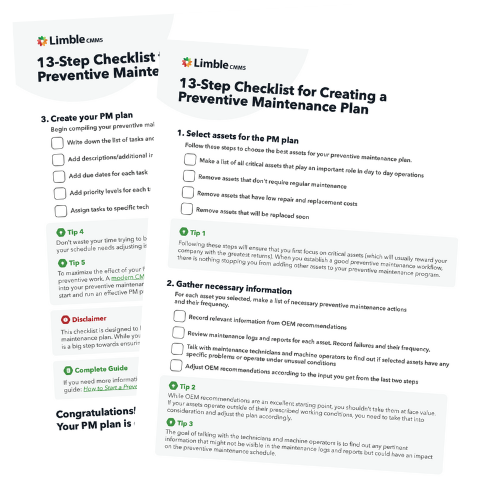
Checklist for Creating a Preventive Maintenance Plan
Following a consistent Preventive Maintenance Plan can make life easier. Use this checklist to create your own!
Total Effective Equipment Performance (TEEP)
TEEP widens its focus even further to consider manufacturing performance against a baseline of continuous operation, running 24 hours a day, seven days a week, all year round.
Stoppage for any reason, such as the factory stopping overnight or on weekends, will impact availability and reduce the final TEEP percentage.
TEEP is a more strategic metric that gives insight into a plant’s total available production capacity and efficiency of asset usage.
TEEP vs OOE vs OEE
If that was a little too abstract, we can always nail it down by introducing one more visual aid.
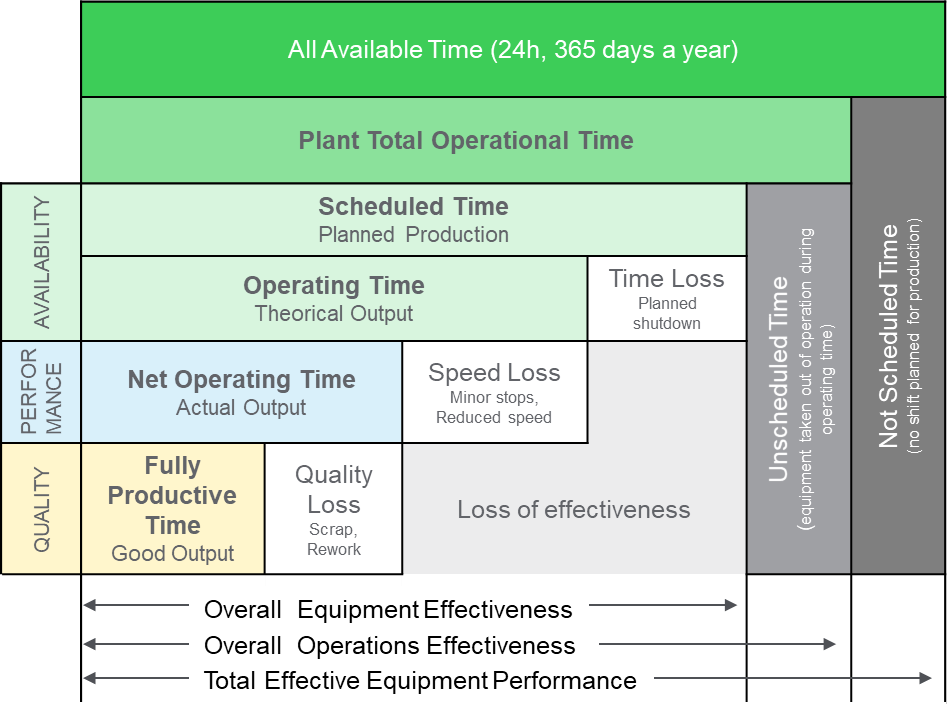
OEE vs OOE vs TEEP. Source: Schneider Electric
In the graphic above, you can clearly see how the availability factor differs from metric to metric. It is very important to understand these nuanced differences before you make significant changes on your plant floor.
Total Effective Equipment Performance formula and calculation example
When managers seek to understand where their business might increase production capacity, TEEP provides useful insight into how efficiently the business uses the current equipment and resources.
Let’s introduce an example we can use as a reference point.
Assuming three months for our measurement, say August through October, the total calendar time available for production will be 2,208 hours (92 days x 24 hours). If the production line operates fully for 2,208 hours in that period, it will achieve 100% TEEP.
However, our production facility only runs two eight-hour shifts, based on a five-day work week. From that, our planned production time is easy to calculate.
Planned production time = 16 hours x 92 days x (5/7) working days in a week
Planned production time = 1472 x 0.72
Planned production time = 1051 hours
Therefore, the best TEEP we could hope for, if all ran perfectly, is 48% (1,051 hours of scheduled time, divided by 2,208, and multiplied by 100 to get a percentage). This 48% is the availability figure we will use in our final calculation.
Unfortunately, but as expected, everything does not run perfectly. Our factory sometimes experiences equipment failure; combined with repairs and maintenance times, we reach an average downtime of 2.9 hours every day. Therefore, our performance is 82% (13.1 hours divided by 16 and multiplied by 100).
Finally, while product quality is good, it’s not 100%. During the three months in our example, the factory ran into quality issues and product quality averaged 91% — some products required rework.
If we run the TEEP formula using those numbers
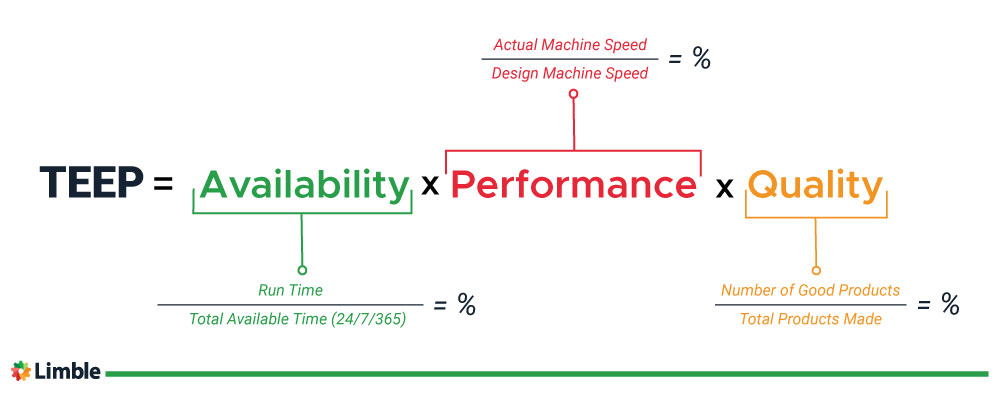
TEEP = Availability x Performance x Quality
TEEP = .48 x .82 x .91
TEEP = 36%
The TEEP for August through October was 36%.
Using TEEP to improve operational efficiency
The example above highlights several areas of improvement available to a manager wishing to increase production output. They might consider:
- Adding shifts on the weekend
- Adding overtime shifts during the week
- Targeting the cause of the excessive downtime
- Investigating quality improvements
It could be that planned maintenance is a cause for the downtime. In this case, a solution might be to schedule planned downtime on weekends when the equipment is idle, lessening the impact on uptime. This would, however, increase the cost of maintenance.
On the other hand, those costs are likely to be offset by the increased performance, resulting in greater production numbers, increased revenue, and an improved bottom line.
TEEP allows a broad overview of actual plant performance versus its potential. By encompassing all facets of the business, a manager can:
- Choose to dive deep into operational issues that impact the metrics, such as inefficient shift changeovers or excessive machine-cleaning times.
- Review tactical measures like rescheduling planned maintenance or adjusting equipment cycle times, to maximize the available time for the manufacturing process using the resources that are readily available.
Consider strategic issues, including additional shifts, purchasing extra equipment, entirely new equipment, or increasing staff numbers.
Want to see Limble in action? Get started for free today!
A holistic view of your manufacturing operations
Running a manufacturing facility is a complex operation. It forces you to focus on day-to-day operational issues to keep things going.
However, manufacturing is also asset- and resource-intensive. It’s important to periodically do a sanity check. You have to take a step back and review how efficiently the business is using those assets and resources.
When a manager is seeking to increase production capacity, either on existing products or to accommodate new clients, a TEEP analysis can help you understand where they may gain such capacity in the most cost-effective manner.
FAQ
Why use CMMS software to track maintenance metrics?
Using CMMS software simplifies tracking complex maintenance metrics, fosters data-driven decisions, enhancing efficiency, reducing downtime, and aiding in regulatory compliance all in one.
Is Limble Mobile CMMS app user friendly?
Limble is consistently rated Easiest-to-Use CMMS on review sites like G2, Capterra, and Software Advice. And our customers agree. With our mobile CMMS app, teams experience 30%+ better productivity, on average, requiring little to no training or ramp-up time. Our CMMS app can travel with your team, no matter where they go! Visit our App Store or Google Play for more information.
Can I connect to other systems?
Limble provides seamless, pre-built CMMS Integrations with the most widely used software systems. That means no help from a developer or your IT team is required. Learn more about our integrations.
How secure is the Limble CMMS platform?
At Limble, our world-class data security practices ensure your account information is safe. We use state-of-the-art technologies and industry best practices to maintain a secure infrastructure, including SOC-II Type II certification, regular penetration testing, and continuous security training for our staff.


-Concept-Explained")