In manufacturing industries, calculating Overall Equipment Effectiveness offers deep insights into the performance of production processes and enables data-driven improvements.
Determining Overall Equipment Effectiveness (OEE) is a standard method for assessing the productivity of production lines compared to their potential. Organizations in manufacturing sectors including pharmaceuticals, food & beverage, and utilities use OEE data to eliminate inefficiencies and drive continuous improvement.
Availability, performance, and quality
OEE measurements rely on three separate metrics. Manufacturers take this trio of OEE metrics into account to get a holistic look at the effectiveness of their processes and assets.
- Availability: How often does the asset or system function at a given time and under given conditions?
- Performance: How much does the asset or system produce?
- Quality: How many defect-free products does the asset or system create?
OEE in lean manufacturing
OEE scores are particularly important for lean manufacturers. In lean environments, all efforts are tailored toward eliminating sources of waste and fostering continuous improvements. It’s all about avoiding the Six Big Losses. You’ll notice that these are tied to the qualities used to calculate OEE.
- Availability losses: Breakdowns (equipment failure, unplanned downtime, missing tools, etc.) and Setup & adjustments (changeover, startup time, etc.)
- Performance losses: Reduced speed (operator errors or inefficiencies, slow cycles, incorrect settings, etc.) and Small stops (jams, bottlenecks, obstructions, cleaning, inspection, idling etc.)
- Quality losses: Startup rejects (rework, scrap, etc.) and production rejects (rework, scrap, etc. during production)
Learn all about calculating OEE to assess manufacturing productivity in this video.
How do manufacturers calculate OEE?
Organizations determine the overall equipment effectiveness of their systems and manufacturing processes by multiplying performance, availability, and quality.
Calculating performance scores
You can find a system’s performance score by dividing its actual throughput by its maximum possible throughput. Performance losses occur when manufacturing processes are forced to run below their maximum speed.
Here’s the formula for calculating performance and an example:
Performance = (Total Parts Produced / Total Run Time) / Ideal Throughput
((20,000 parts / 400 minutes of run time) / 60 parts per minute) x 100 = 83.3%
Calculating availability scores
You’ll calculate availability by determining the ratio of actual run time to planned production runtime for your system.
Here’s the formula for calculating a system’s availability and another example:
Availability = ((Planned Production Time – Stop Time) / Planned Production Time) x 100
((500 minutes – 100 minutes) / 500) x 100 = 80%
Calculating quality scores
Quality scores look at the percentage of quality parts you produced compared to the number of defective parts.
Here’s the quality formula and yet another example:
Quality = Total Good Parts Produced / Total Output
(1000 good parts / 1250 total parts) x 100 = 80%
The OEE formula
Once you’ve completed these calculations, you’re ready to determine your overall equipment effectiveness score. To keep it simple, move the decimal point to the left for each figure.
OEE = Performance x Availability x Quality
.8333 x .8000 x .8000 = .5312
.5312 x 100 = 53.12% OEE
This figure offers a starting point for eliminating sources of inefficiency and carrying out process improvements. It should play an important role in initiatives aimed at eliminating unnecessary production losses and maximizing the total time spent in operation.
OEE vs. OOE vs. TEEP
Overall equipment manufacturing is closely related to two more system performance metrics: Overall Operational Effectiveness (OOE) and Total Effective Equipment Performance (TEEP). Though all three look at availability, performance, and quality to assess systems, they differ in how they define and calculate availability.
OEE looks at availability by comparing runtime to scheduled and planned production time. When you calculate OOE, you look at availability by comparing total production time to your plant’s total operational capacity. TEEP calculations use the broadest possible definition of availability, comparing actual uptime to the total number of hours in a year.
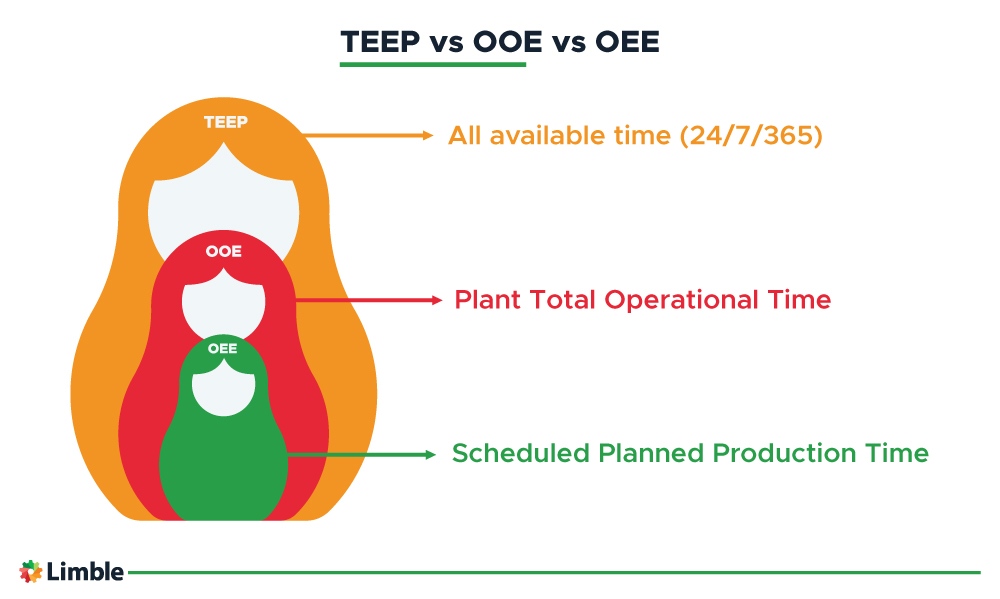
Here’s how Overall Equipment Effectiveness, Overall Operations Effectiveness, and Total Effective Equipment Performance relate to one another.
How does OEE in manufacturing relate to maintenance?
OEE is a valuable metric for evaluating maintenance teams. All three of the scores that go into OEE calculations tell you how well maintenance takes care of assets. Along with industry standards, OEE calculations offer useful baselines for assessing maintenance’s impact on asset performance and the success of manufacturing operations as a whole. They are especially useful for organizations that aim to achieve Total Productive Maintenance (TPM) and maximize efficiency.
What are the benefits of improving OEE in manufacturing?
When teams commit to improving OEE, they see a range of benefits.
- More productivity and efficiency: Reducing unnecessary downtime across the production line helps manufacturers achieve their ideal cycle times. This means more efficient use of resources and higher production rates.
- Reduced maintenance costs: Improvements to OEE drive down overall maintenance costs by minimizing scrap, rework, unplanned downtime and other contributors to excess costs.
- Improved equipment reliability and lifetime value: An emphasis on OEE entails more preventive and proactive maintenance to ensure maintenance teams address equipment issues promptly and keep them running effectively as long as possible.
- Enhanced product quality: By reducing defects and encouraging consistency, OEE improvements make production processes more dependable and ultimately better satisfy customer expectations.
- Data-driven decision making: All that performance data offers useful guidance for making decisions of all types to carry out process improvements.
How can manufacturers achieve world-class OEE?
- Take an OEE-driven approach to preventive maintenance: A more preventive, data-driven approach to asset management helps boost the factors that contribute to OEE. Introducing automation will enhance your abilities to spot signs of trouble early and keep machines in peak condition.
- Trace issues to their source: Don’t just settle for collecting and storing data, make it the source of dependable business improvement. Diving into performance and failure data makes it possible to track issues to their source, conduct root cause analyses, and make a change.
- Build a culture of continuous improvement: Your team should never settle for good enough. Remember that OEE scores provide useful guidelines for driving improvements and continually making the maintenance department everything it can be.
- Leverage the right technology: Maintenance 4.0 demands far more advanced resources than spreadsheets alone. Edge computing and IoT devices with real-time data collection and monitoring capabilities make it easier to analyze the production data necessary for making improvements, benchmark the performance of assets and systems, and tracking progress against KPIs. Check out some of Limble’s case studies to learn about how implementing Computerized Maintenance Management Systems has helped customers maximize the bottom-line impact of their maintenance teams.
Start the transition to preventive maintenance
Raising your OEE scores starts with taking a more proactive approach to managing your assets and maximizing their performance. Check out our guide to evolving beyond reactive maintenance and start your journey today.