Remember when Samsung had to recall the Galaxy Note 7 phone because it kept exploding? They ended up dedicating 700 engineers and built an entire facility just to solve this one problem. In all, the fiasco is estimated to have cost $10–$17 billion.
Can you imagine how much better off Samsung would be if they had tested for a defect like this before launching the product? FMEA is just the analysis tool for this situation.
This article will give you a detailed introduction to FMEA and FMECA. It will show you how to use your Computerized Maintenance Management System (CMMS) to make your testing even more successful.
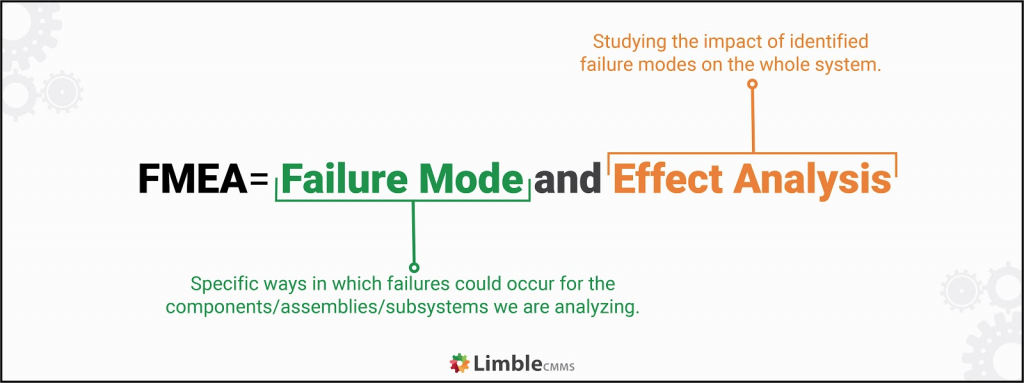
What is FMEA?
Failure modes and effects analysis (FMEA) is a method that reveals:
- The failure modes — the ways something could go wrong.
- The “domino effect” those flaws would have on the rest of the system.
It searches for the weak points in materials, manufacturing processes, and subsystems, then steps back to look at the big picture.
The FMEA process was one of the first ways to systematically look at potential problems. It is at the core of engineering for reliability, safety, and quality control.
To identify the failure modes (again, the way something could go wrong):
- Look at how similar products/processes have failed in the past.
- Take into account the physical characteristics of your materials. For example, you can assume a component will fail in a 200-degree-Fahrenheit environment if its thermal plastic is only rated to 140 degrees.
Depending on how bad the fallout would be, you can either:
- Make changes to decrease the chances of it happening.
- Lessen the impact the failure will have on the rest of the system.
The end goal of FMEA and FMECA is to eliminate (or at least minimize) chances that the system will have severe breakdowns. Knowing the potential weaknesses and their potential effects on the whole system makes it easier to decide which parts can be adjusted to make it more reliable.
What is FMECA?
Failure mode effects and criticality analysis (FMECA) is easy to grasp. It is like FMEA, but it adds a criticality analysis or ranked list.
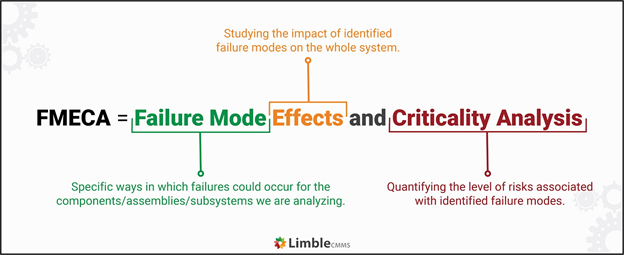
Basic FMEA is qualitative and only explores “what-if” scenarios. When we add the criticality analysis from FMECA, you get a number that will allow you to rank your failure modes. This makes it easier to prioritize your work and (hopefully) keep problems from happening in the first place.
History and types of FMEA
FMEA was developed around 1950 and was first used by the U.S. military to create better weapons. FMEA worked so well for the military, it was quickly adopted by NASA, then the aviation and automotive industries, and so on.
We can split FMEA into three categories based on what we are looking at:
- Design failure mode and effects analysis (DFMEA) aims to create long-lasting products. It considers how the product might fail at each phase of its life cycle.
- Process failure mode and effects analysis (PFMEA) looks at each step of a process. Think of sourcing, assembly processes, transportation, data processing, etc. It determines where the process could break down.
- Functional failure mode and effects analysis (FFMEA) looks at the system as a whole. Instead of correcting the failure, it tries to bypass it entirely. (Think back on our example of avoiding broken levers on paper towel dispensers by switching to motion sensors.)
The role of CMMS in failure analysis
CMMS software helps maintenance experts manage their work. Remember how reviewing past breakdowns is a key step in FMEA? Suppose you are studying a machine or process in your facility. In that case, your maintenance crew may have been gathering that data for you all along.
A robust CMMS like Limble will have logged:
- Everything that has broken
- When it broke
- Why it broke
- What was done to fix it
- Whether it broke down again
The more user-friendly the CMMS is, the more (accurate) data you will have.
How to perform FMEA analysis
FMEA and FMECA aim to provide a list of potential failure modes ranked by:
- Importance: Is it a key component?
- Effect: What else happens if it fails?
- Probability: How likely is it to happen?
Use an FMEA table or worksheet to guide your decisions about changes that could prevent failure from spreading.
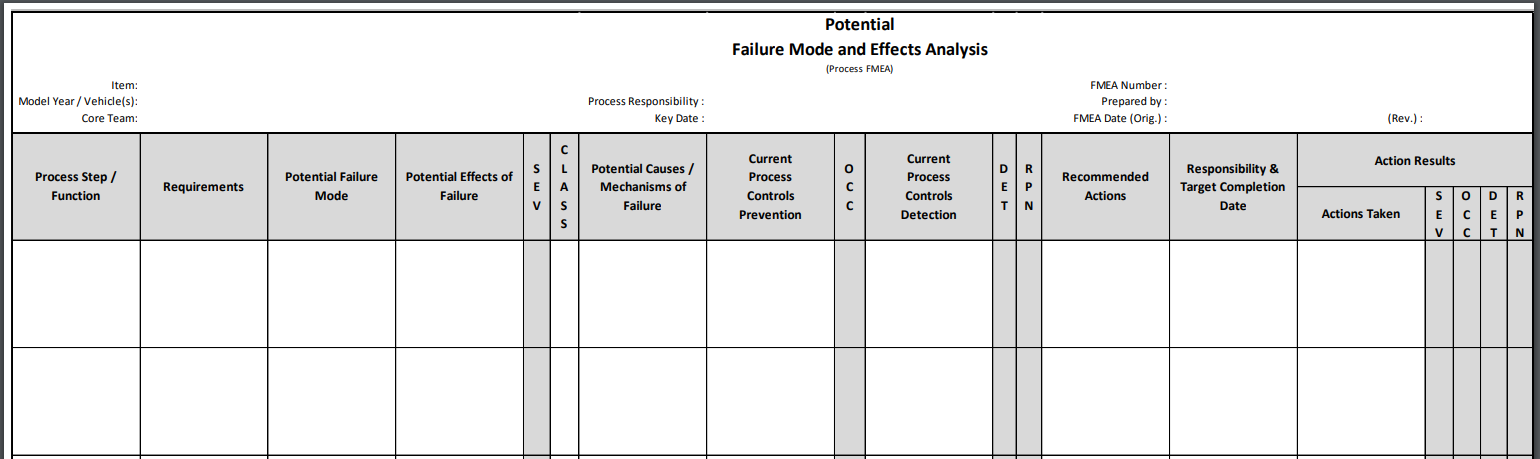
Example of process FMEA worksheet. Source: Quality One
Step 1: Decide which FMEA you will use and gather the necessary information
As outlined in the intro, there are three types of FMEA:
Design FMEA takes the entire life span of the component into consideration at the design stage. You will look at things like material properties, interface between components, geometry, and engineering requirements.
Process FMEA considers all the steps (processes) that lead to the final product and is popular in manufacturing. You will look at processing methods, machinery, and maintenance strategies.
Lastly, Functional FMEA thinks about the big picture rather than focusing on individual parts.
Once you have decided which type of FMEA to perform, the next phase is to gather as much information as possible to describe the product/process in detail. This can be done with the help of drawings, schematics, component lists, and interface information, to name a few resources.
Consider using a tree or block diagram to make it easy to see the relationships between the different parts.
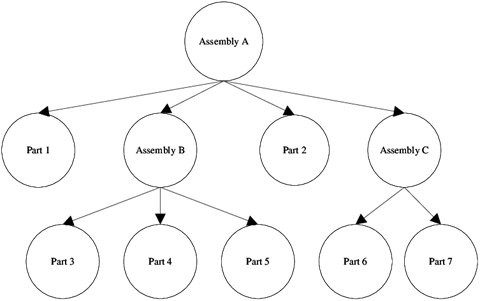
Example of a tree diagram. Source: ResearchGate
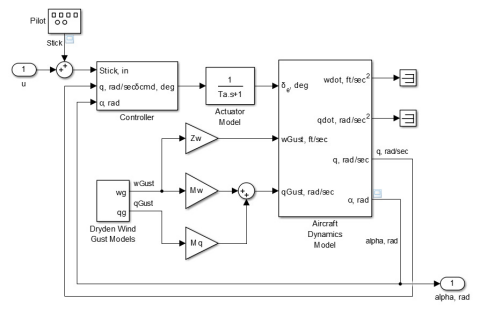
Example of a block diagram. Source: MathWorks
Step 2: Identify potential failure modes
Refer back to your tree and block diagram. For each item on the chart — and each of its connections — write down all the ways it could break down. Approach it from a variety of angles.
Get creative! There are many ways in which an asset can malfunction:
- part/system performs an unintended function
- poor performance
- reduced functionality
- failure to complete the intended function
Here are some “hidden” failure modes that are not easy to spot:
- cracking
- electrical short circuit
- torque fatigue
- excessive deformation
- so many more possibilities…
The data from your CMMS will be rich fodder for this step. Let these past unexpected breakdowns open your eyes to failure points you had not considered before.
This step is time-consuming. Let it be. The goal is to be as thorough as humanly possible.
Step 3: Do a failure effect and cause analysis
Failures propagate, so for each component/step, ask yourself, “If this node stops performing, what happens downstream?”
Think about its impact on the environment and customers/users–both internal and external. The more you invest early on in creating a robust, detailed diagram, the easier this step will be.
As you fill out your FMEA worksheet, think about each failure in two directions: What it affects downstream, as well as what upstream could cause such an issue in the first place like:
- Human error (like using the wrong type of material for load-bearing walls)
- Material defects (like low-quality material due to the manufacturer’s poor standards)
- Incorrect engineering requirements (like failing to follow engineering standards that stipulate minimum area requirements for a steel frame support)
This upstream thinking is called root cause analysis (RCA).
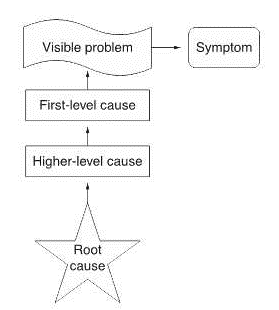
Root cause diagram. Source: ASQ
Step 4: Assign severity rankings
Rank each failure on a scale of 0 to 10 where:
- 0: This failure has no measurable impact.
- 10: This failure would be dangerous and requires immediate intervention.
You are looking at the impact on users, downstream operations, the environment, and anyone or anything else that could be affected. Think of it in terms of dollars and cents, physical safety, time loss, damage to equipment, etc.
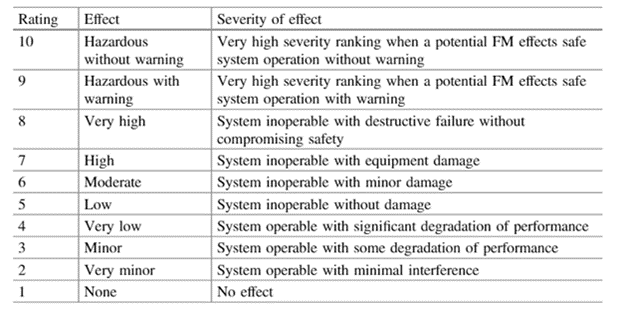
Failure mode severity ranking for FMEA. Source: Soyer
Step 5: Assign occurrence rankings
In this step, consider how often this failure is likely to happen.
Sidenote: You are answering this question for the failure on that row of your worksheet — not for the residual failures that it triggers.
For example, let’s assume the failure is “substandard building material causes the wall to give way.” You are answering how often the wall is likely to fall, not how often the equipment is destroyed because the wall fell on it.
Once again, you rank possible failures on a scale of 0 to 10 where:
- 0: This failure is unlikely to ever happen.
- 10: This failure is virtually guaranteed.
Probability of occurrence classification for FMEA. Source: Soyer
Step 6: Evaluate and assign failure detection rating
Consider how easy or difficult it will be to detect this failure with the control systems you currently have in place. The “control system” could be a complex array of custom sensors, or it could be a quick visual inspection to look for dripping oil.
Ideally, you will detect the problem before it results in a complete failure — for either the component or the whole system. Think about all of the places you could put process control systems to catch the issue before it cascades.
Rank each failure on a scale of 0 to 10 where:
- 0: You are almost guaranteed to detect the failure early.
- 10: Neither the failure nor its possible causes can be detected.
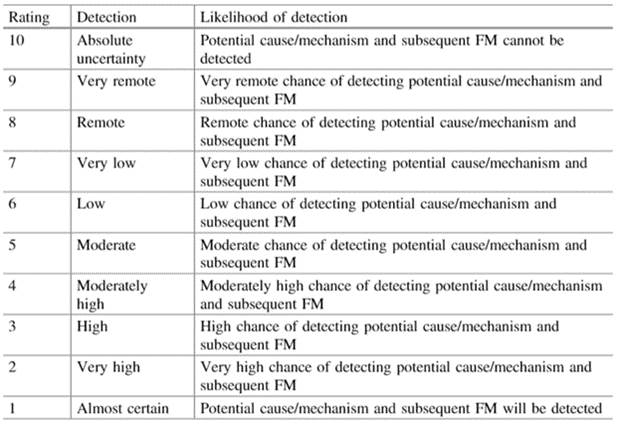
Detection rankings for FMEA. Source: Soyer
If there is a low likelihood of detection, ask yourself:
- Is there a different product component or process step I can use where this malfunction is detectable?
- If I cannot detect the process or product failure, how quickly could I detect the damage? What systems would I need to put in place?
- If automatic monitoring simply isn’t possible, can I make periodic testing a part of our routine maintenance protocol?
Step 7: Calculate RPN
RPN stands for risk priority number. Calculate your RPN by multiplying the three rankings you calculated above.
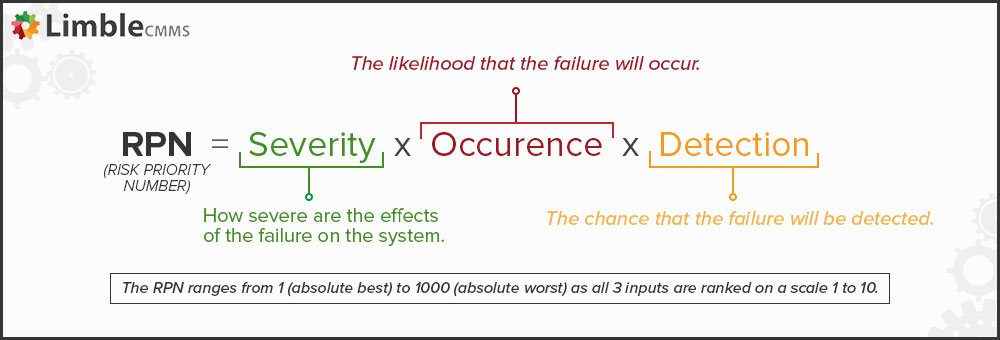
A moderately severe failure (5 out of 10) with a very low chance of occurrence (2 out of 10) but also high difficulty of detection (8 out of 10) has an RPN of 80 (5 x 2 x 8).
Do this calculation for every failure on your worksheet, and order the failures from high risk to low risk. Consult with your team to determine a “critical” level. In some industries or settings, that might be 90. In others, it might be as low as 50.
Some failures that seem minor could be triggers for other malfunctions that are downright catastrophic, so hopefully, you were mindful in each step above. Mountains and molehills are not so easy to distinguish in complex systems.
Step 8: Take action
Starting at the top of the list, look for ways that you could lower the RPN by adjusting at least one of the three factors that contribute to it:
- Occurrence: Make the potential failure causes more robust, so they fail less often. If possible, remove that component altogether.
- Detection: Add more control plans. There are innumerable sensors available, many of them with alarms or IoT integrations. These condition monitoring systems are an integral part of condition-based monitoring and predictive maintenance.
- Severity: Put controls in place so that the consequences are not so significant. For example, wildfire fighters dig lines that make it difficult for a fire to spread from one area to another. That way, any one section catching fire is not as big of a deal as it would have been without any natural barriers.
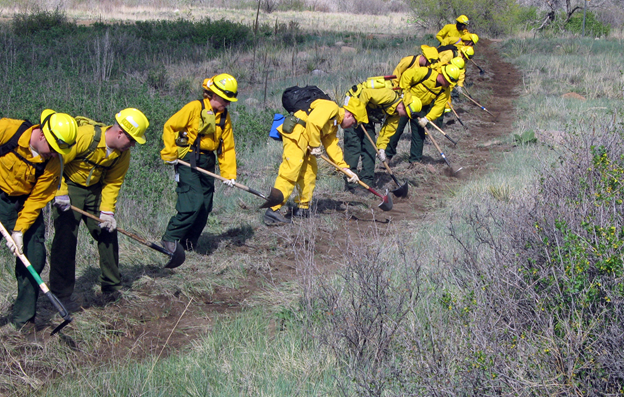
Firefighters digging a fireline. Source: Department of Defense
[limblequote]As a rule, the severity rating is the most difficult to adjust. It should not be reduced unless you have made a significant change to the design or process.[/limblequote]
Step 9: Recalculate RPN
When you have implemented your improvements, redo your occurrence, detection, and severity rankings, and recalculate your RPN. If you are still above the critical threshold, look for more ways to mitigate the failure.
If you are below your critical threshold, congratulations! You are free to move on to the next failure.
Mean Time Metrics Calculator
Just getting started with maintenance metrics? Use this helpful calculator with formulas and calculations.
FMEA example
Let’s have a look at the FMEA process when designing a bicycle brake cable. First, you made sure you understood the bicycle as a whole. You listed the failure modes and the effects of failure. You assigned rankings and calculated the RPN.
Here is the worksheet you produced:
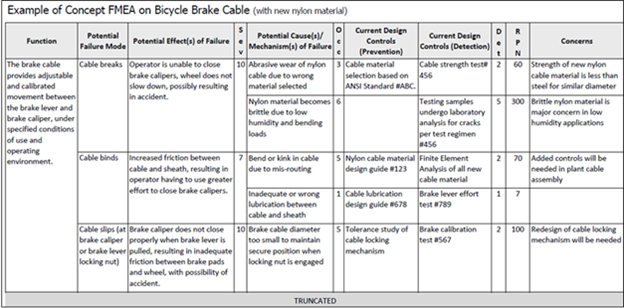
FMEA applied to bicycle cables. Source: Weibull
At an RPN of 300, the worksheet makes it clear that the first issue to tackle is your cable material. Environment and loading will affect nylon’s material properties, which will cause an accident if the rider cannot close the brake calipers. This is a design issue (material choice). You need to look for nylon substitutes that perform as well or better but do not have the same safety issues in low humidity.
After selecting your new material, you recalculate your RPN.
How to perform FMECA analysis
As we mentioned at the beginning, FMECA is an FMEA plus criticality. Just like FMEA, it has a worksheet:
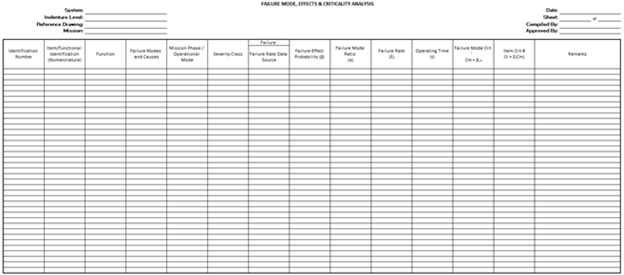
FMECA Worksheet. Source: Quality One
Step 1: Perform FMEA
Having read the sections above, you are practically a professional at this point.
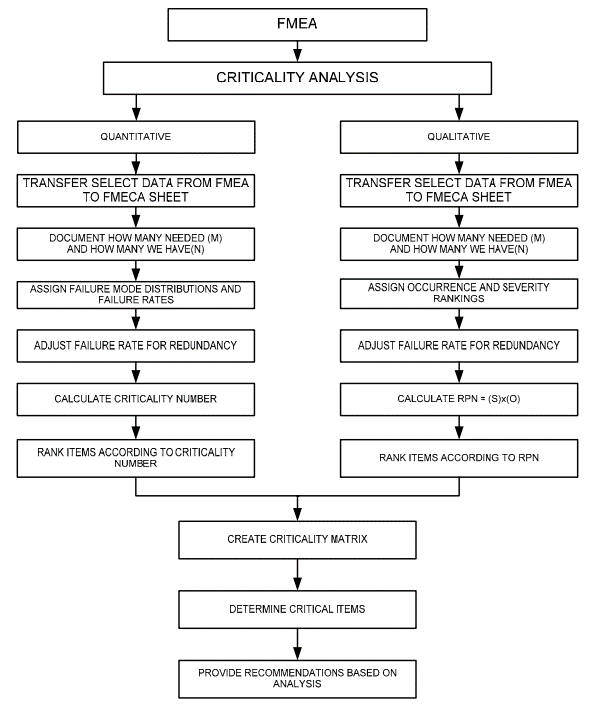
FMECA flow. Source: WBDG.org
At this point, you have a big choice to make: Will you use the top-down approach or the bottom-up approach?
The top-down approach (also known as the “functional method”) looks at the design requirements. It is usually invoked when creating a new product or new process. If you need to design a bicycle that costs just $50, what kind of failures is that likely to introduce? Low-cost materials are usually low quality, so the frame is more likely to break. To avoid it, you can try making a thicker frame. That kind of thing.
The bottom-up approach is used most often on products or processes that already exist. It looks at each component individually – then as a part of bigger and bigger systems. Sound familiar? The first steps we outlined for the FMEA approach are inherently bottom-up. They say to list all your components and assess their potential failures one by one.
Step 2: Determine your parameters
You get to choose whether to make this a qualitative or quantitative analysis. If you have rich historical data, go quantitative.
Step 2a: Qualitative parameters
As in the FMEA, you will look at severity and occurrence.
The goal is to label the failure:
- Catastrophic: Considerable losses to the environment, human life, and business operations.
- Harmful: The system is compromised and cannot perform its intended function. Trying to use the system causes additional damage.
- Marginal: There is some level of degradation, but it can still perform its functions.
- Minor: Although there is degradation, the component/step continues to function optimally.
- No impact: You do not know whether a failure has occurred.
The official military standard for criticality analysis uses a specific 1 to 10 ranking:
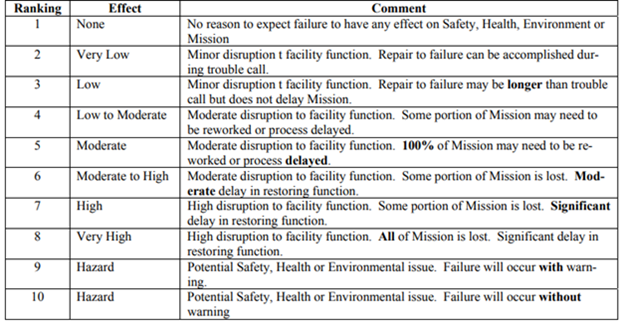
Example of severity ranking according to MIL-STD-1629. Source: WBDG
In other cases, there are four severity levels for FMECA instead of our original five. Frankly, it’s different in just about every industry.
After that, rank the chances of occurrence according to your team’s designated FMECA procedure, such as the table below:
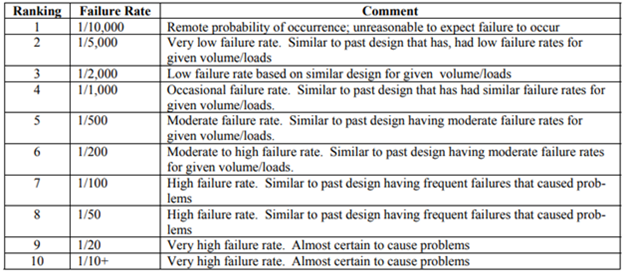
Failure rates for FMECA. Source: WBDG
Step 2b: Quantitative parameters
Instead of a gut check (like all the rankings so far), this step lets you fall back on hard data. Looking at known failure rates, use specific mathematical formulas with specific variables to calculate the failure mode criticality number.
You probably want us to go into more detail, but those advanced concepts are far beyond the scope of this article. For some juicy reading, start on page 4-7 of this technical manual instead:
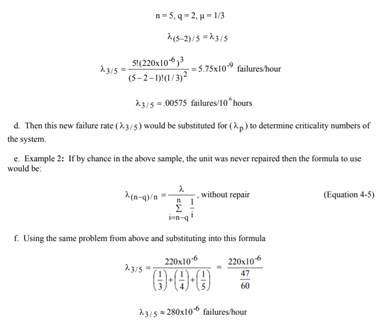
Example FMECA equations from the US Army’s technical manual MIL-STD-1629
Anyway, when you are done with all that, you will have a failure mode criticality number representing how often a particular failure node occurs. It quantifies the consequences of that failure by summing up all the failure criticality numbers.
Step 3: Adjust failure rate for redundancy
During the FMEA process, you discovered potential failures and took corrective action. One of those recommended actions may have been introducing redundancy — backup systems that correct for the same failure but in different ways.
Again, accounting for those redundancies requires complex mathematics, but MIL-STD-1629 is an excellent reference.
Step 4: Calculate criticality number or RPN
If this is a quantitative CA case, you got your criticality number in step 2b. For quantitative, you calculate your risk priority number. Depending on your industry and detection methods, you may calculate RPN using occurrence X severity X detectability as outlined above. Otherwise, your particular case may only require occurrence X severity.
Step 5: Create a criticality matrix
A criticality matrix is a visual representation of failure modes ranked by their likelihood and severity.
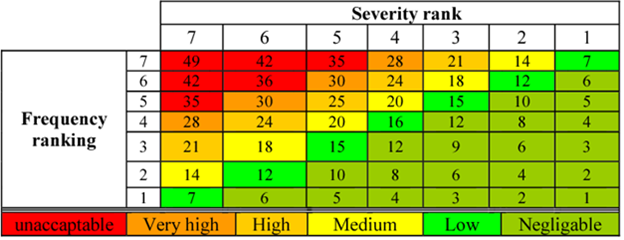
Example of a criticality matrix. Source: Semantics Scholar
Severity is plotted on the x-axis and probability (frequency) on the y-axis. Components with a low failure mode will end up in the bottom right (the green area), while high failure mode components will be in the top left (the red area).
Step 6: Determine critical items and take appropriate action
I’m sure you can guess which region of the criticality matrix deserves your full attention. Take steps to lower the chances of any of those malfunctions happening:
- Modify your designs to control for potential risks posed by parts/steps you cannot change.
- Make changes that reduce the likelihood of failure.
- Create redundancies that add an extra layer of security and make the systems more fault tolerant.
- Replace specific pieces to optimize performance.
- Build up your systems that detect failures early on.
Of course, after changing anything, update your calculations and your matrix. Rinse and repeat until you no longer have critical issues.
FMECA example
Let’s look at how this could be applied in the oil and gas industry.
In the example below, you broke the water supply (the primary system) into different subsystems. Each subsystem gets its own criticality number.
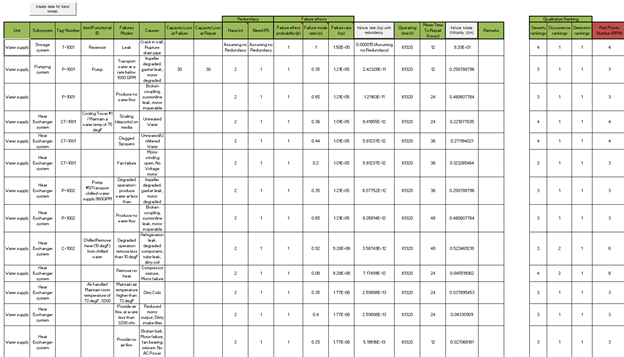
FMECA applied in the oil and gas industry (open in new tab). Source: DNV
Immediately, we can see that these folks did both qualitative and quantitative criticality analyses. The redundancies are accounted for in all the subsystems. You can see that they included the failure rate both with and without redundancies.
Notice that the RPN values are all below 10. Does that mean the failure mode is not critical? Not necessarily. Remember, early in the process, your team set the thresholds for your particular industry or scenario.
Nonetheless, we can see that the severity for the storage system is higher than for the pumping system.
What can be done to remedy that? Remove the pumping system’s redundancies, of course. Just kidding!
The goal is for the risk assessment to come in low across the board. You know that. For the heat exchanger failure mode, better controls to detect scaling due to untreated water and a more robust preventative maintenance plan are some of the ways to adjust the criticality and RPN values.
If it is worth doing, it is worth doing right
Performing FMECA and FMEA analysis is not something that should be done just for the sake of it. It is a fairly complex process that brings huge benefits, but only if it is executed correctly.
This article aims to provide a comprehensive overview so you have a better idea of what to expect. For those that are doing it for the first time, it is recommended to first go through proper FMEA training. Six Sigma is a great place to start for engineers and non-engineers alike.
Final thoughts
Until now, we have mentioned a CMMS only as a data source to help you identify and quantify ways that your product or system could fail. But knowledge is only valuable when put into action.
When all is said and done, your CMMS is how you will ensure that your plans are carried out.
You may determine that wear and tear on your manufacturing line’s conveyor belts is the root cause behind your excessive downtime. In a robust CMMS like Limble, you can create a preventive maintenance routine to check conveyor belts weekly. Limble will:
- generate the task
- automatically assign it to the right team member
- log when it is completed
- tabulate the cost of the task in labor and parts
- update inventory counts as spare parts get used
- alert Purchasing when parts run low (long before they run out)
Finally, Limble compiles reports showing the financial impact as your maintenance team transitions from run-to-failure (fixing things that broke) to a preventive maintenance strategy (keeping things from breaking in the first place).
Whatever action you prescribe based on your FMEA or FMECA analysis, you look good when you can translate it to dollars saved instead of (billions of) dollars lost.
Request a demo to start the journey.

Very good topics
I need to identify the parameters of how can I state the parameters for verification process to determine the uncertainty and risk factors
Comments are closed.