 Only a small percentage of equipment failures occur due to aging.
Researchers have identified many equipment failure patterns, and have calculated the percentage of failures each of them represents.
Understanding these patterns helps reliability and maintenance managers develop maintenance strategies that prevent specific failure causes, increasing asset life and reliability while reducing maintenance costs.
A brief history of failure pattern studies
Before 1960, maintenance thinking relied heavily on fixed overhauls and defined maintenance periods. However, in-service experience showed little improvement in asset performance despite diligent adherence to the planned maintenance schedules.
In order to improve equipment reliability, many organizations researched failure patterns and causes. The three most notable studies include:
- F. Stanley Nowlan and Howard F. Heap published a report in 1978 called AD/A066 579, Reliability-Centered Maintenance. This document proved to be an influential work that formed the foundation of the maintenance practices used in aviation today.
- In 1992, John Moubray introduced RCM II, which used an almost identical approach to Nowlan and Heap, but focused on establishing safe minimum maintenance levels for other industries.
- The Naval Sea Systems Command activity, SUBMEPP, completed their study in 1998, generating age and reliability curves from submarine maintenance data. Their findings allowed the Navy to delete many time-directed component overhauls and considerably reduce maintenance costs.
The Essential Guide to CMMS
Download this helpful guide to everything a CMMS has to offer.

Six common failure patterns explained
The following six unique patterns reported in the findings of failure pattern researchers Nowlan & Heap continue to be validated through studies today.
In the following graphs:
- the Y-axis shows the conditional probability of failure
- the X-axis shows the operating age of the component
Failure Pattern A: The Bathtub Curve
The bathtub curve is the most recognized failure pattern.
Component populations that exhibit bathtub failures show a high failure rate at the start of their operating life, known as infant mortality.
These failures decrease and stabilize for most of the component’s useful life. The failure probability increases toward the end of the lifespan, known as the wear-out zone.
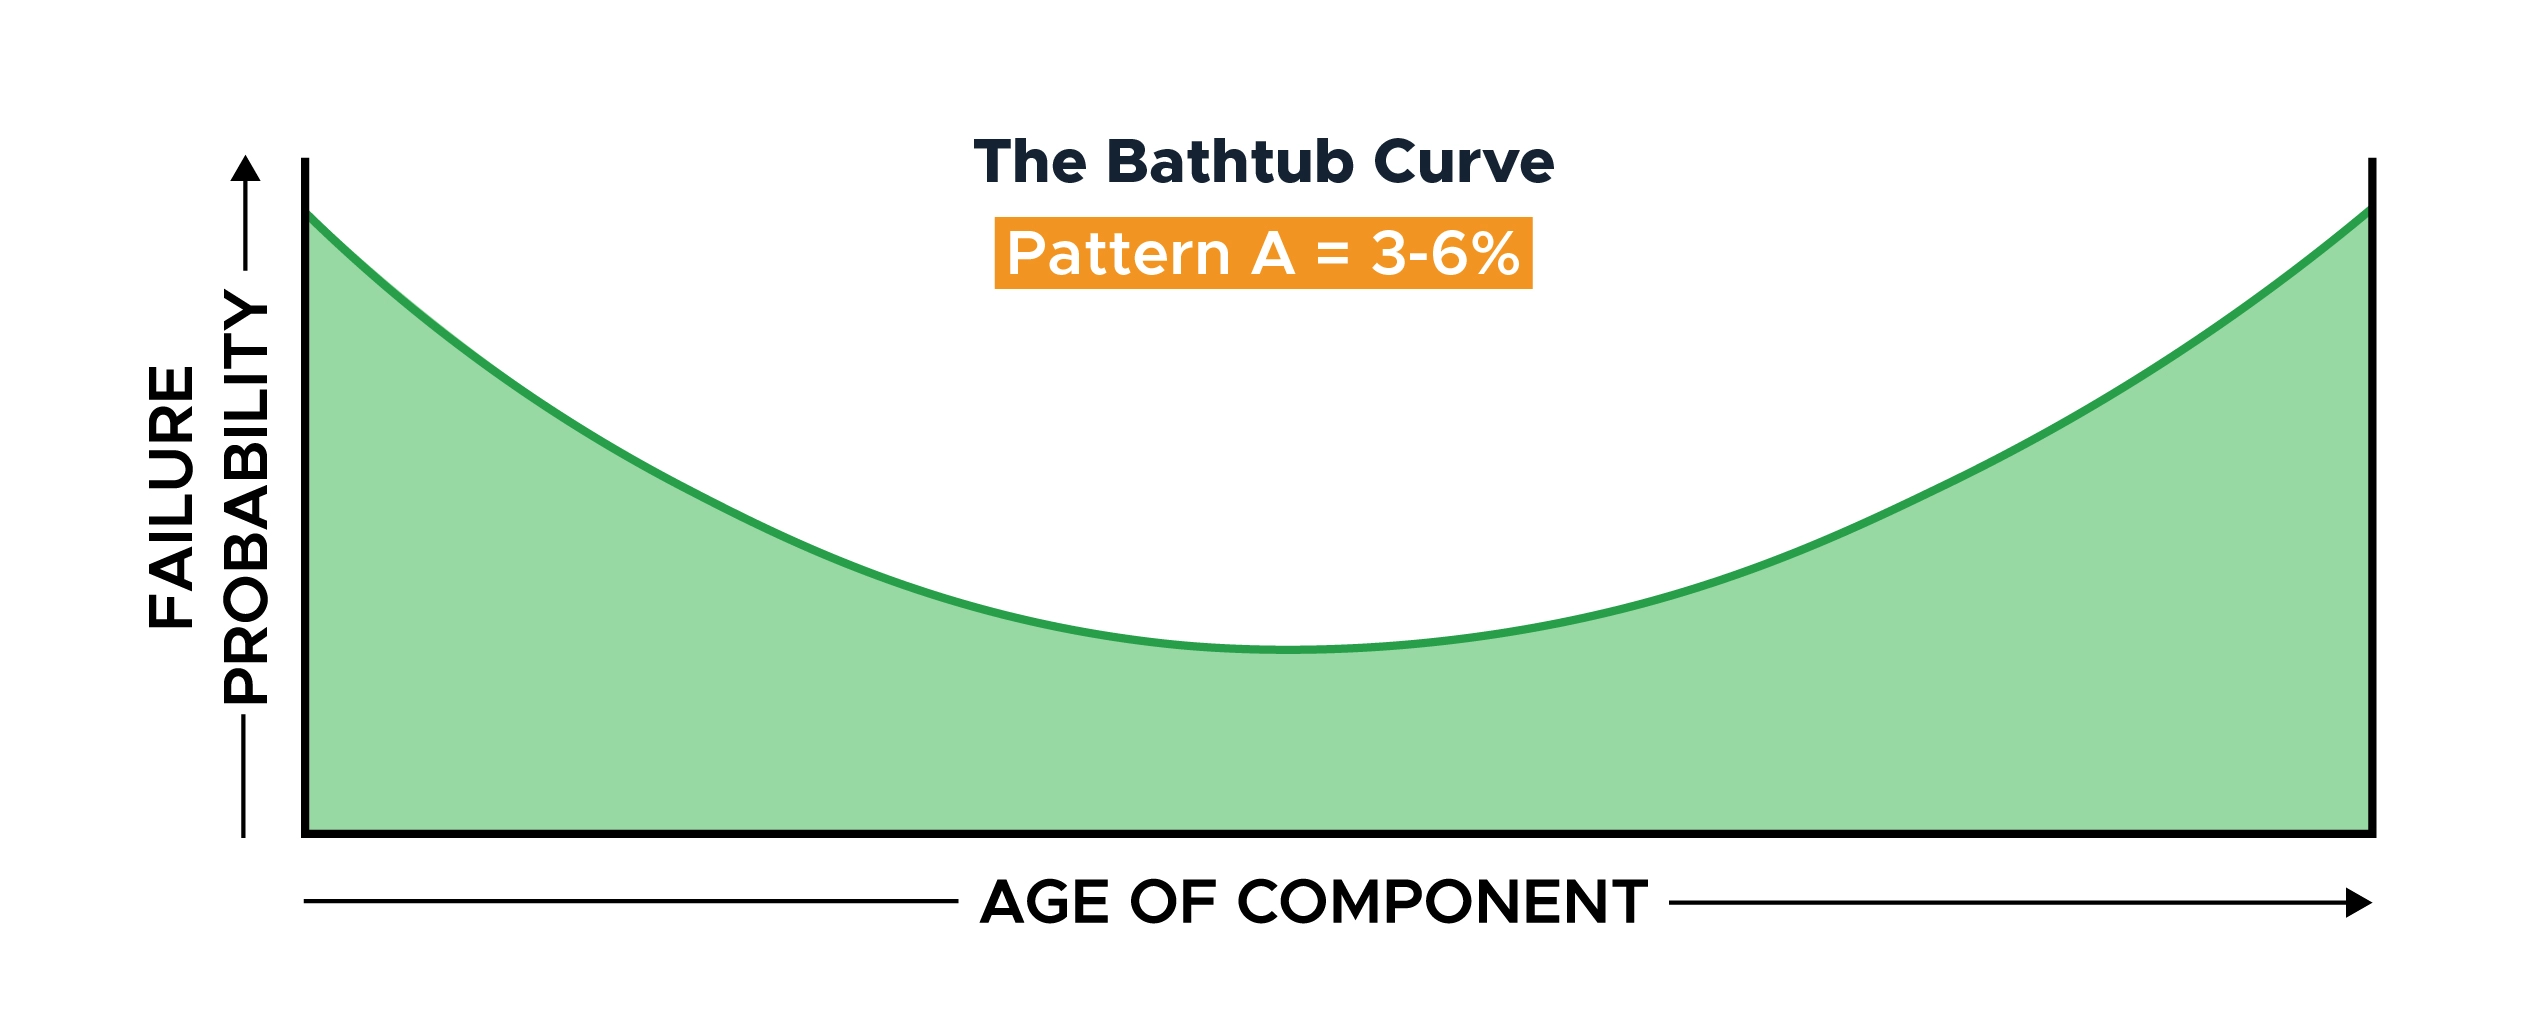
The challenge for maintenance providers is battling through the heightened chance of initial failure before settling into a consistently low random failure probability. We must then change the component out before entering the wear-out zone.
In the 1960s study on civil aviation, approximately 4% of components conformed to the bathtub curve failure pattern. A Swedish study in Broberg in 1973 calculated 3%, and the SUBMEPP study in 1993 reported 6%.
Examples of components that exhibit bathtub failure pattern:
- Electrical components like computer hard-disk drives or current relays; while early failures can occur, once burnt in, they will run at low random failures until they wear out from age and use.
- Sleeve bearings in large diesel engines and ship propeller shafts. Early failures occur due to bedding-in problems and/or defects in material or workmanship. Those that pass this stage will run for long periods without significant failures. The failures that do occur will be due to oil quality issues, rotor problems, etc. Eventually, the bearing metal will wear out.
Failure Pattern B: The Wear-Out Curve
The wear-out curve shows a stable and low level of random failures for most of its life before sharply increasing toward the end of its useful life.
In effect, this is the bathtub curve without the infant mortality phase. This lack of infant mortality might be due to the component type or a rigorous supplier quality system that removes all components with early failure.
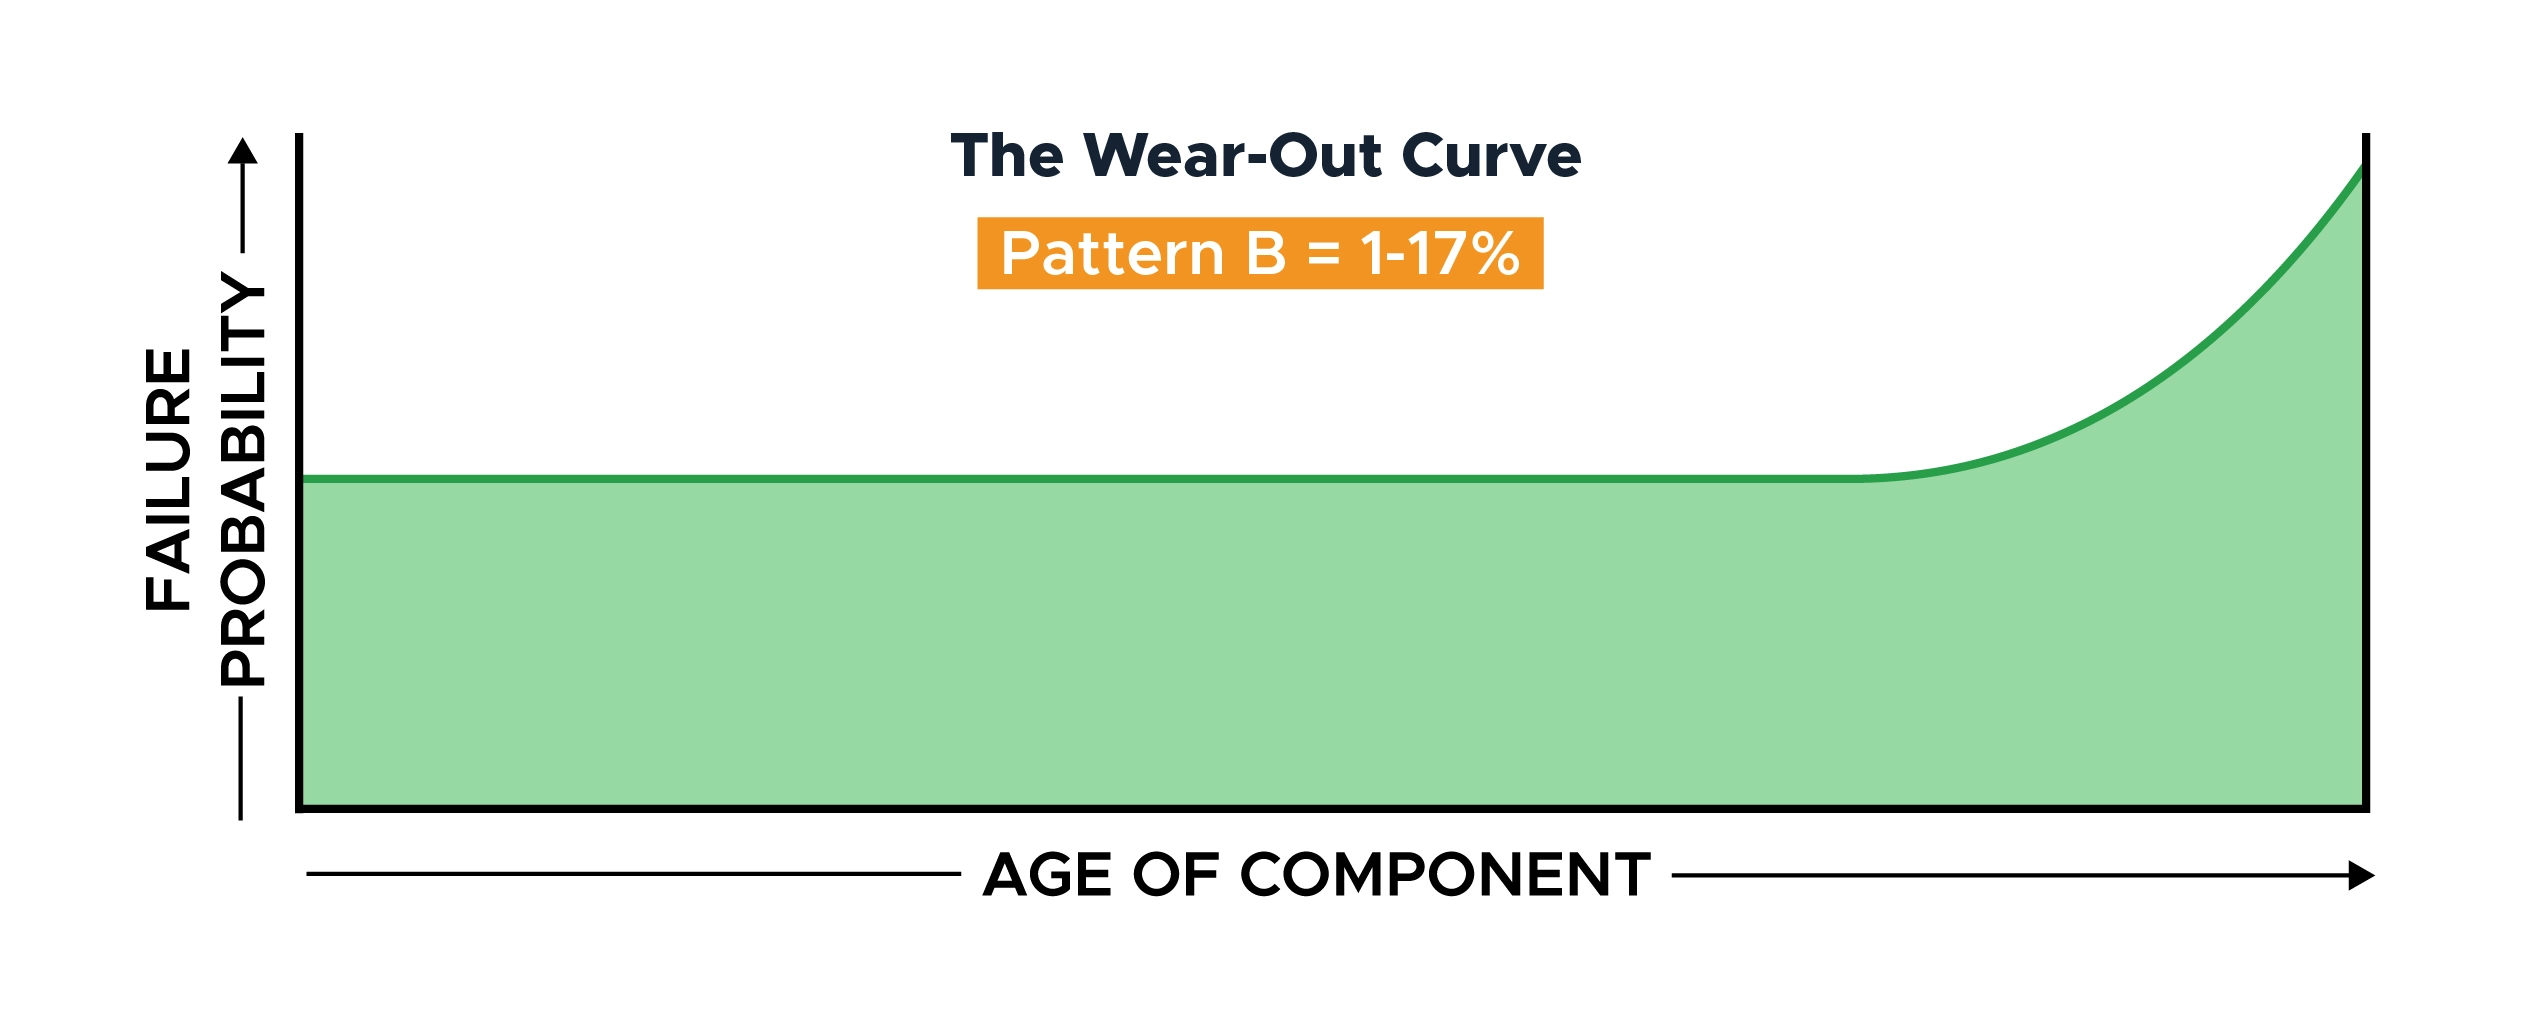
Replacing the component before entering the wear-out phase is a good way to improve equipment reliability.
Nowlan & Heap’s UAL study reported 2% of components showed the wear-out failure pattern; Broberg’s 1%, and SUBMEPP’s a huge 17%.
Examples of components that follow the wear-out failure pattern:
- Phosphor bronze or white metal bushes are classic examples of components subject to wear out. They will operate well if lubricated and maintained, but as they age, the shaft clearances increase, accelerating wear until vibration or leakage occurs.
Failure Pattern C: The Fatigue Curve
The fatigue curve shows a constant increase in the probability of failure as the component ages.
There is no defined break-point before which you can plan replacement. Therefore, your decision to replace the item occurs once the failure probability reaches an unacceptable level for your business.

This pattern covers 5% of all failures in the UAL study, 4% in Broberg, and 0% from SUBMEPP.
Examples of components that exhibit the fatigue failure pattern:
- Fatigue failure is common in components subjected to cyclical loads, like gear teeth, springs, or drive shafts.
Failure Pattern D: The Break-In Curve
The break-in curve has a very low probability of failure at the beginning of the component’s life.
The probability increases early, settling at a constant conditional probability for the remainder of the component’s life.
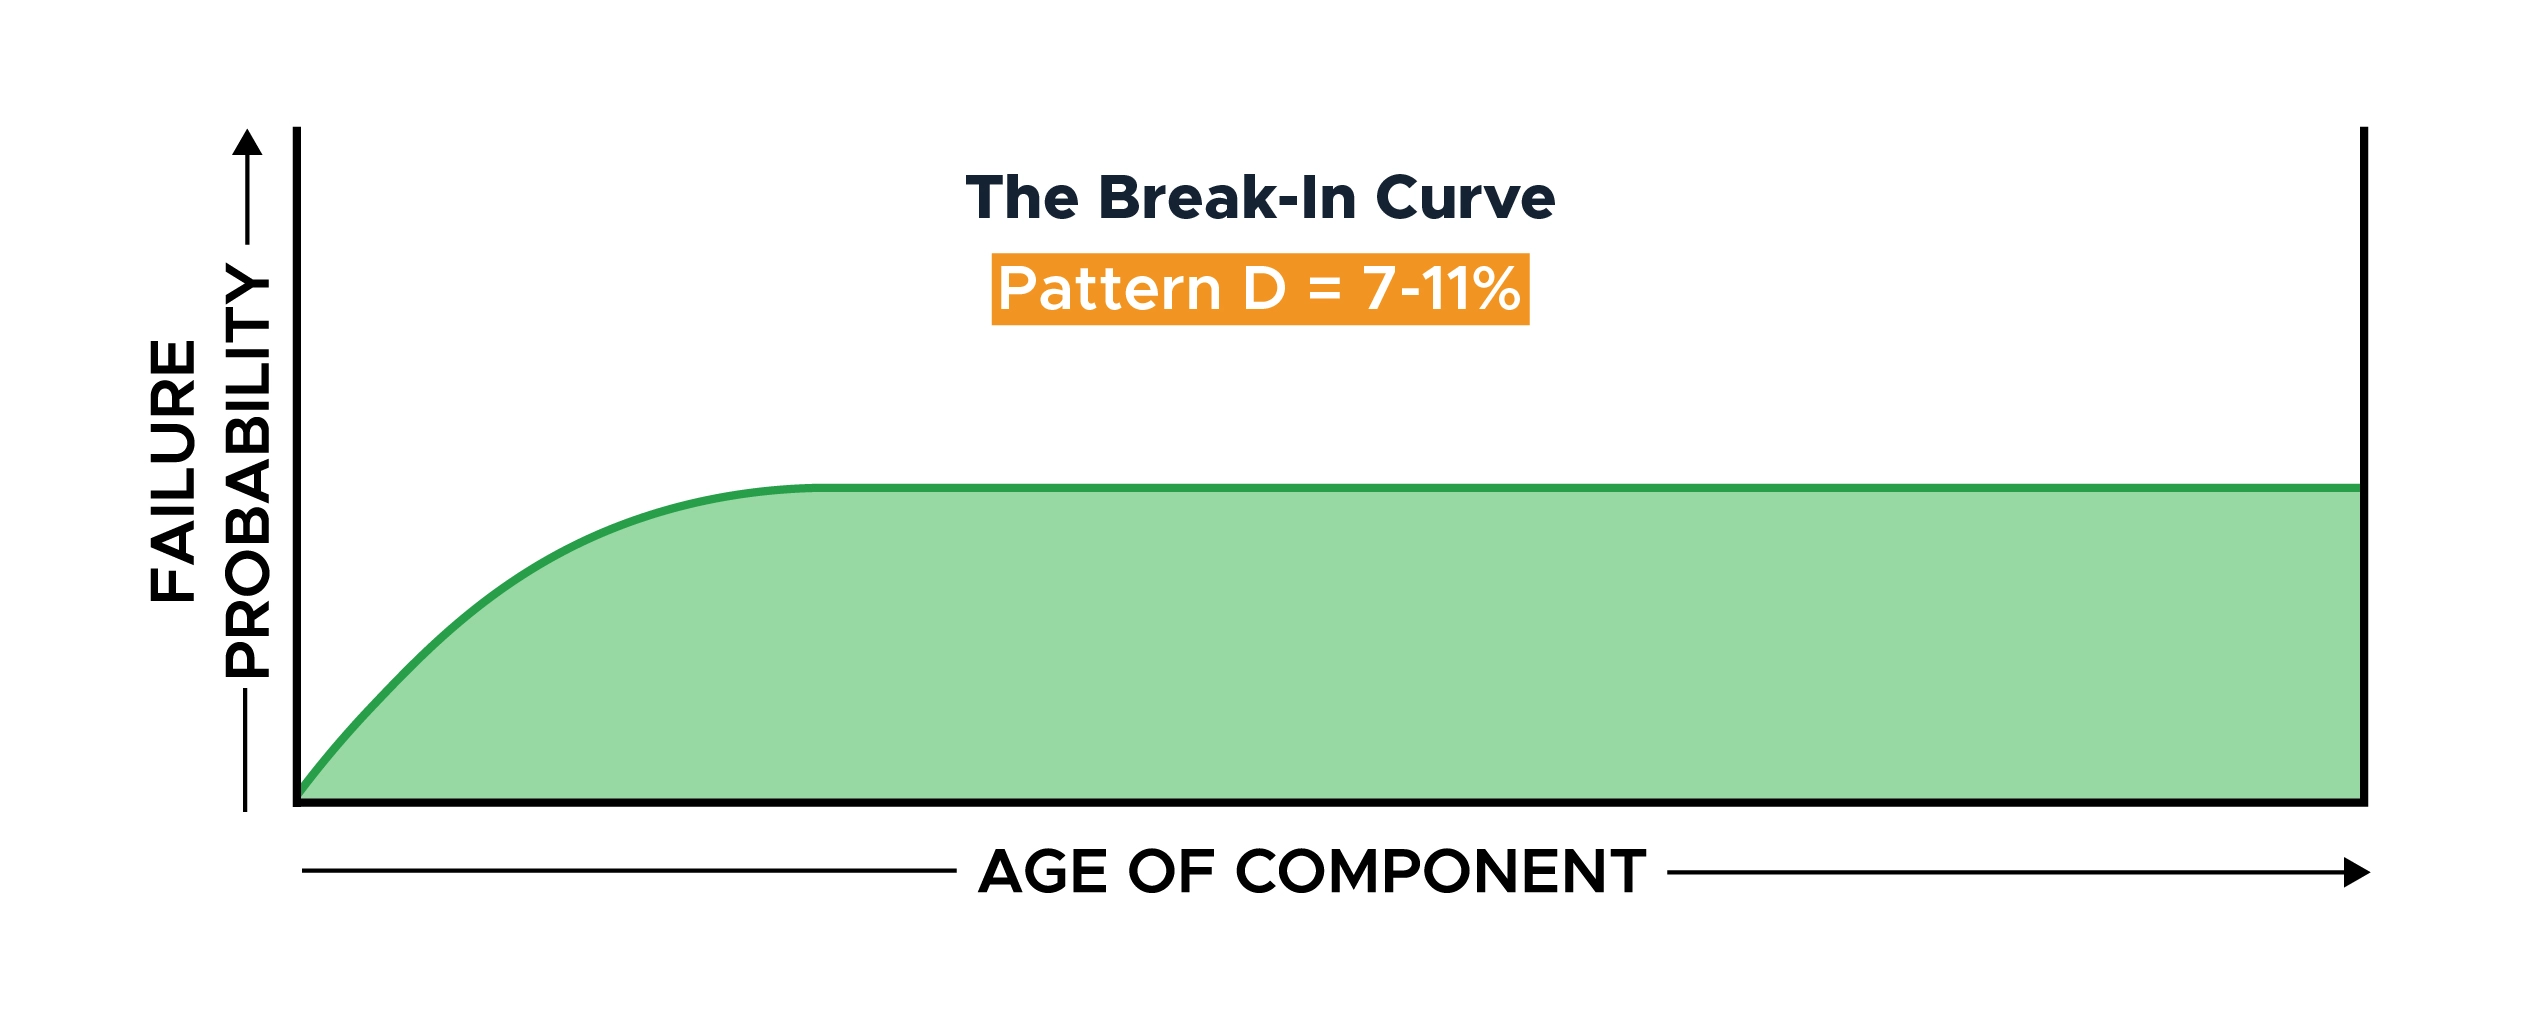
There is no value in replacing this component to improve reliability, as the initial rise in failures forms a small percentage of the overall useful life of the component.
This break-in curve covered 7% of all failures at UAL, 11% in Sweden, and 0% in the submarine service.
Examples of components that exhibit the break-in failure pattern:
- A capacitance level sensor is an example of a component exhibiting the break-in curve. Given the role of the component, the manufacturer captures manufacturing defects before shipping. The failure probability of the population increases as each item is subject to in-service environmental factors before exhibiting a stable random failure mode.
- Can also be seen in various electrical components.
Failure Pattern E: The Random Pattern
The failure probability for this component is constant, meaning it has a random failure distribution, without increases or decreases, throughout its lifecycle.
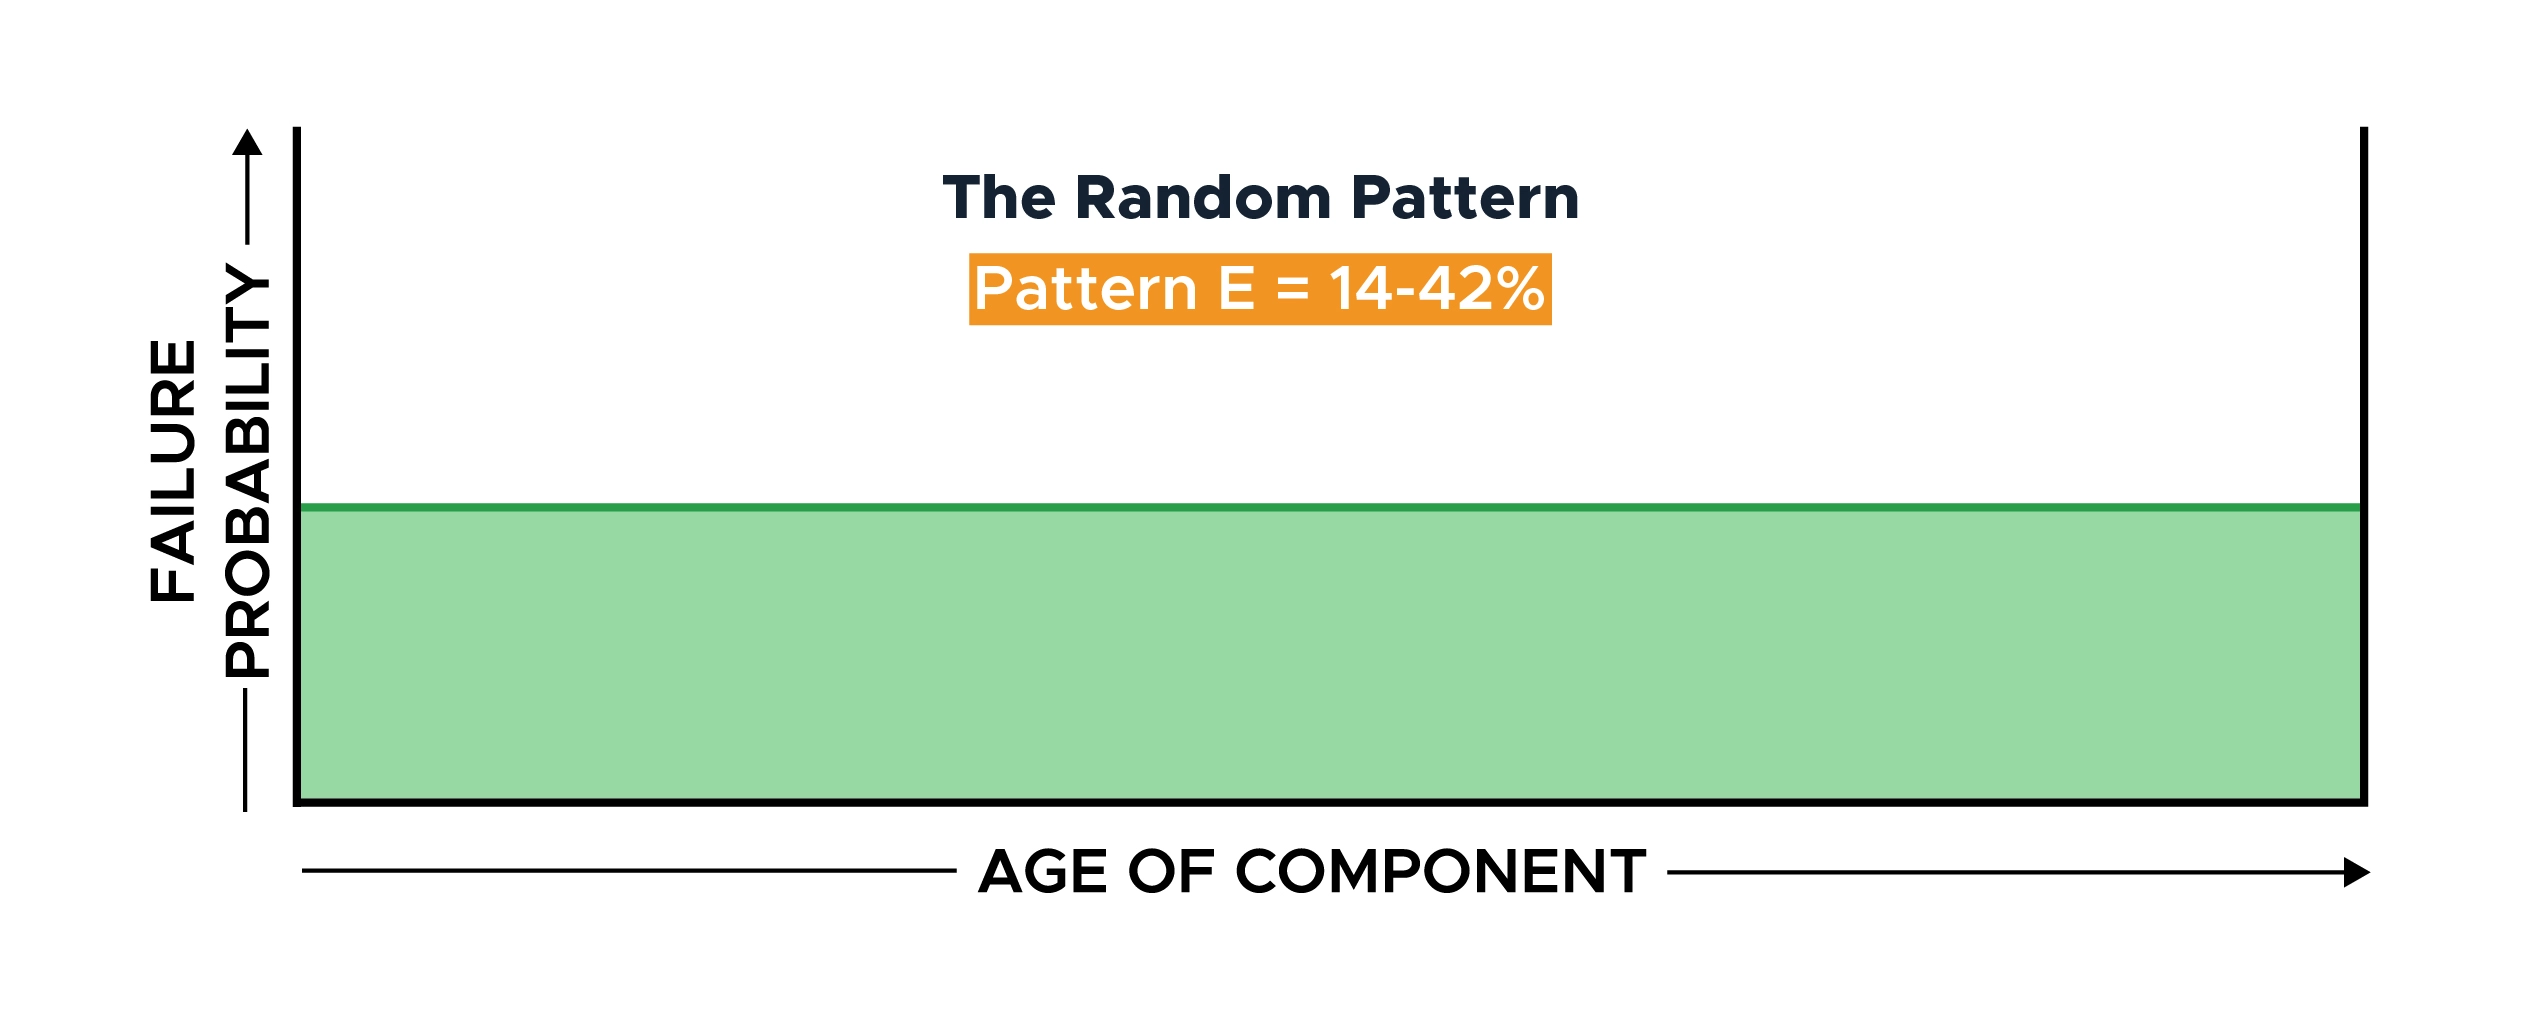
No optimum time exists to change this component, as doing so will not affect reliability.
This pattern accounted for 14% of all UAL failures, 15% at Broberg, and 42% at SUBMEPP.
Examples of components that exhibit the random failure pattern:
- This pattern is rare on mechanical components, which are more likely to exhibit wear out, and on many electronic components, which exhibit infant mortality. However, solid-state memory chips exhibit a constant failure rate due to an implicit self-correction mechanism.
- Random failures can happen due to a seemingly infinite number of reasons — tires punctured by nails, pump suctioning in debris, operator errors, etc. When you aggregate those on a scale large enough, you can get a constant failure rate.
Failure Pattern F: The Infant Mortality Curve
This curve mirrors the start of the bathtub curve, exhibiting high failure probability in the early stages of life before settling into a steady random failure probability for the remainder of the component’s life.
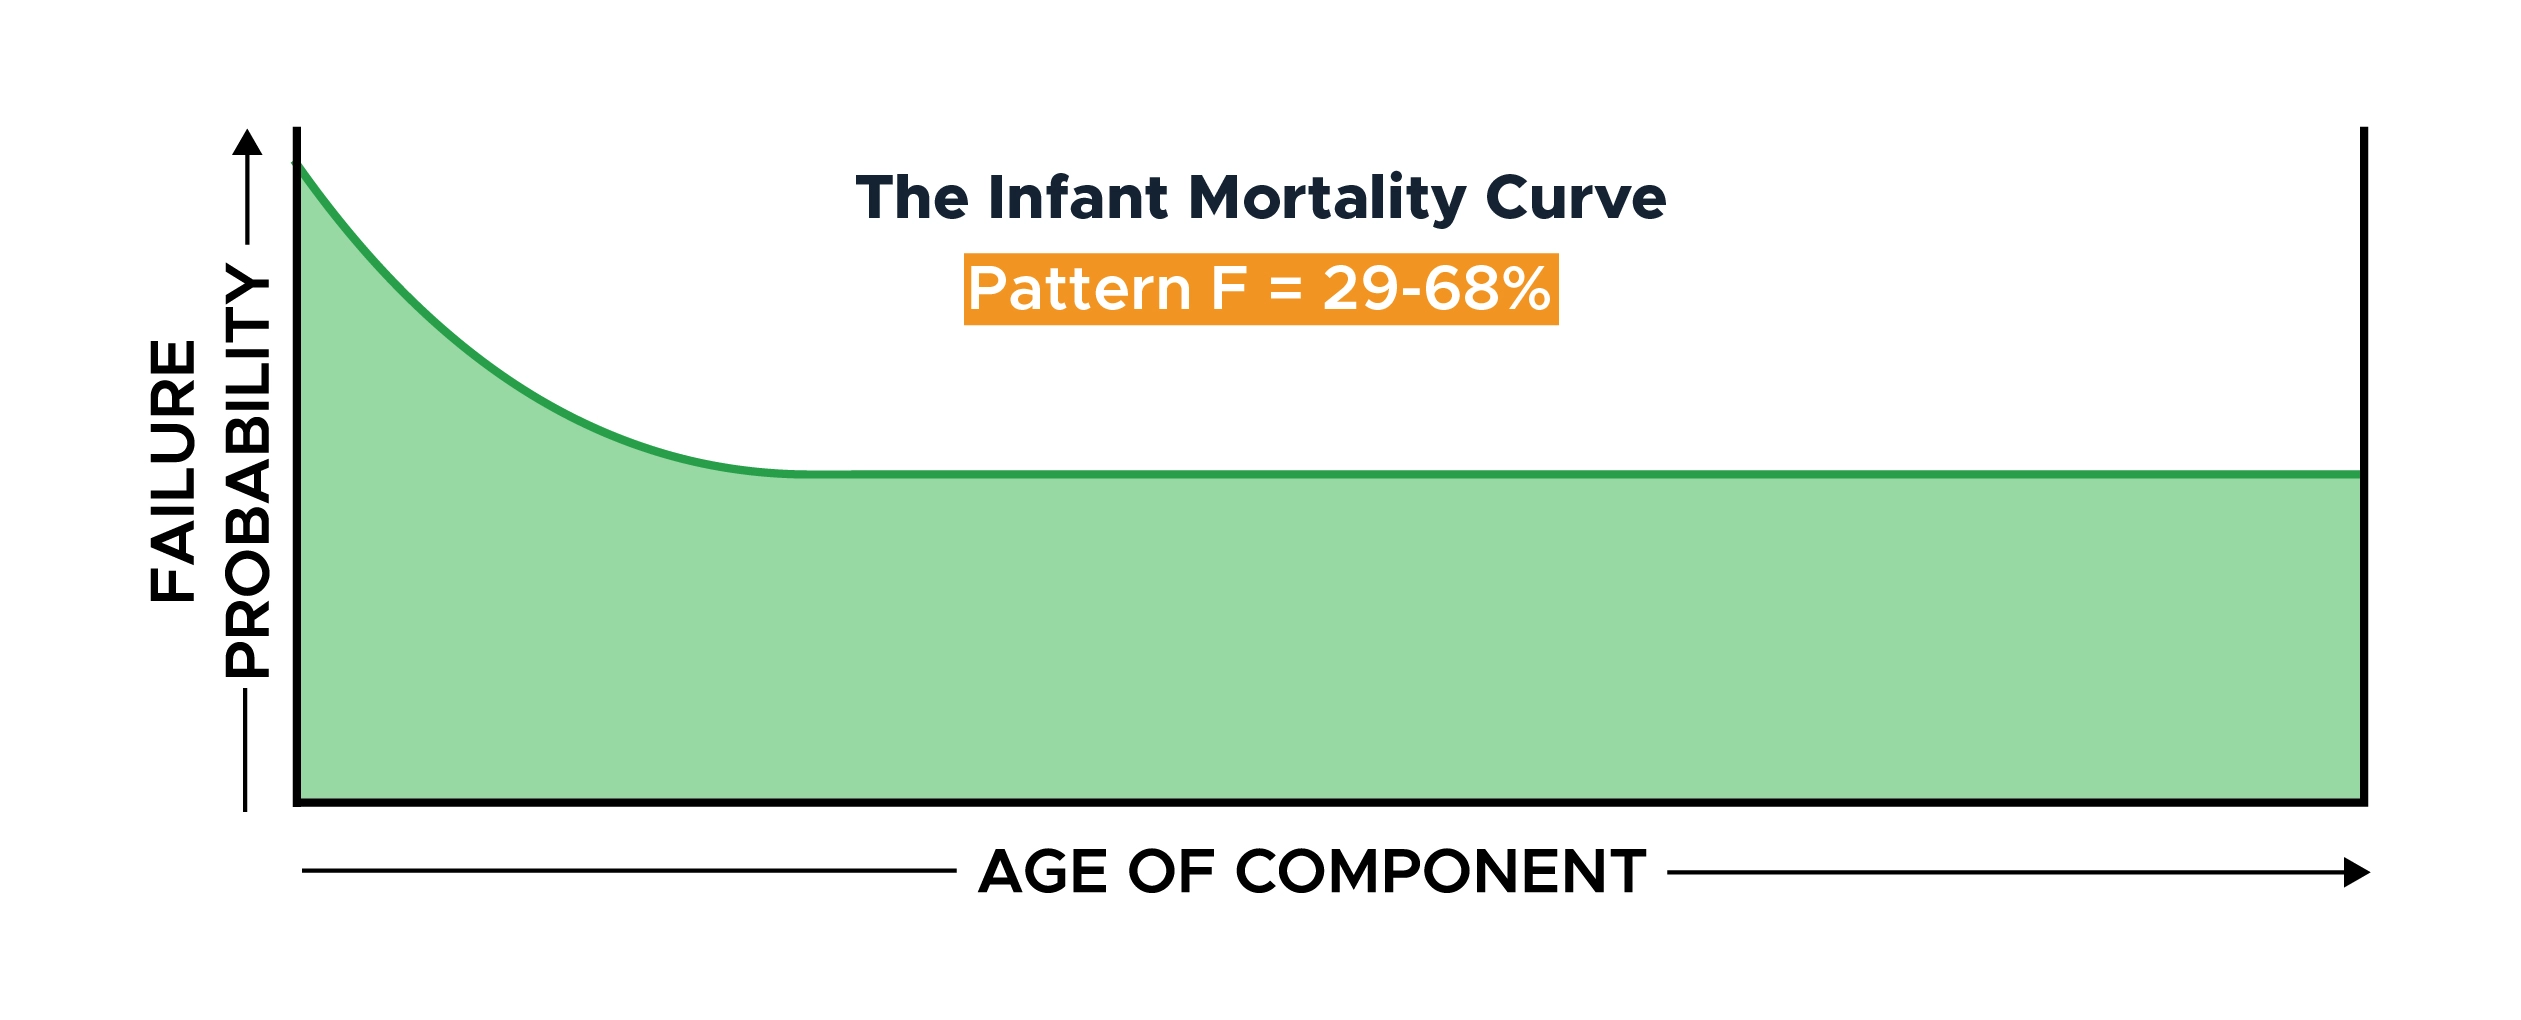
Changing this component doesn’t only provide zero benefits, it actually increases the failure probability by introducing a new infant mortality phase.
This failure pattern accounts for 68% of all Nowlan & Heap’s components, 66% of the Swedes, and 29% of the submarine service.
Examples of components that exhibit the infant mortality failure pattern:
- In general, this curve applies to complex equipment without dominant failure modes. Even though each individual component might follow Patterns A through D, when assembled together, the machine will exhibit a constant failure rate after an initial bedding-in period.
- CPUs and video processing chips are examples of components that exhibit infant mortality before settling into a constant low-level failure rate for the rest of their lives.
Mean Time Metrics Calculator
Just getting started with maintenance metrics? Use this helpful calculator with formulas and calculations.
What failure patterns tell us
While the percentages vary from study to study, we can take some important guidance from these patterns and their implications.

Age-related failures
Patterns A through C are examples of age-related failures where we can define a component’s life. The failure probability will increase once the part reaches a certain age, hours, or cycles in operation.
Wear or corrosion are examples of failure causes. Based on the percentages identified for each curve, only approximately 15% of all components would benefit from having a defined life, providing increased equipment reliability.
Random failures
Patterns D through F have a short period of higher failure probability when new, before settling into a period of low random failures.
While this doesn’t mean that some of these components wouldn’t benefit from preventive maintenance, we will only see small to moderate gains in reliability for an increased cost and administrative burden.
Approximately 85% of all components fall into the random failure category. That is a huge percentage, so it isn’t surprising that we have developed efficient ways to address this problem.
Tools and strategies for handling random equipment failures
The fact the failures are random doesn’t mean there are no signs of imminent failure. Here are some tools and strategies that can help you catch deterioration signs early and extend your P-F interval.
Condition-based maintenance
Nowlan & Heap found the solution to managing random failure components lies in condition-based maintenance (CBM). The CBM philosophy relies on replacing components when visual inspections or remote monitoring suggest that a component is approaching a point of failure.
Currently, most CBM initiatives use sensors connected to critical components to collect real-time data. Computers watch for any changes in the received signals that may indicate component deterioration or potential failure.
Predictive maintenance
Combining condition monitoring with machine learning leads to predictive maintenance, where an analytics engine assesses all possible failure modes and identifies how long the component will continue to operate.
This prediction is sent to maintenance planners to ensure that the planned maintenance intervention, along with spare part allocations, occur right before component failure.
Condition monitoring includes techniques like oil analysis, vibration analysis, sound, temperature, pressure, or electrical current monitoring.
Computerized Maintenance Management Software
Condition-based maintenance requires consistent data, reliability expertise, and equipment failure analysis — all combined to allow a targeted application of appropriate maintenance strategies.
Most organizations use CMMS as a key enabler of condition-based maintenance, enabling data collection, storage, and the real-time monitoring of critical components.
A modern cloud-based CMMS provides processing power and data security for the large data volumes created by CBM. It provides insight into trending conditions, and helps predict the time until failure — well before human monitoring can detect a change.
While implementing a CMMS and CBM system requires an investment in sensors and software, the savings generated by cutting down on excessive maintenance and improving productivity pay back the initial investment rapidly.
However, the benefit to the organization is not reflected solely in maintenance savings. Equipment reliability improves, increasing uptime and lengthening the useful life of your equipment.
Key takeaways
Identifying component failure patterns in the 1960s was a pivotal moment in equipment maintenance. Subsequent studies have repeatedly supported the conclusion that at least three-quarters of all failures will not see reliability improvements from defined overhaul or inspection periods.
Understanding the implication of failure patterns is an important prerequisite for building an effective maintenance program. Such a program minimizes your organization’s maintenance costs and effort while maximizing asset life and reliability.
To learn more about equipment maintenance and reliability, keep browsing the Limble blog.