Finding the optimal time to carry out maintenance work requires a deep understanding of asset failure modes, their maintenance needs, and the P-F interval.
Join us as we explore the meaning, purpose, and use cases behind the P-F curve and the P-F interval.
The equipment deterioration rate is not a constant
Understanding the deteriorating mechanisms of the equipment, predicting impending failures, and developing appropriate maintenance strategies have always been a subject of interest for reliability and maintenance engineers.
Legacy approaches such as breakdown or preventive maintenance were the most common strategies to address equipment failures. The underlying idea was that equipment health deteriorates steadily from installation to its end of life, thus necessitating maintenance at fixed-time intervals.
As the industry matured, the engineers came to realize that a machine’s degradation and failure rates do not remain constant throughout its lifecycle. As the equipment reaches its end of life, its health deteriorates at a faster rate compared to the time when it is installed.
This necessitates that the maintenance is carried out based on the actual condition of the equipment driven by its reliability – which leads us to the concept of reliability-centered maintenance (RCM).
The Essential Guide to CMMS
Download this helpful guide to everything a CMMS has to offer.

Mapping equipment degradation with the P-F curve
RCM for any equipment involves planning proactive maintenance tasks that relate to the determined equipment failures modes we want to prevent. To enable this proactive planning, it is important to map the degradation of equipment health over time – leading to the development of the P-F Curve.
The purpose of the P-F curve is to determine the most effective times to perform maintenance work as it visualizes the deterioration processes of critical equipment. The curve represents different stages of failure development from the time when the symptoms of failure develop to the occurrence of functional failure.
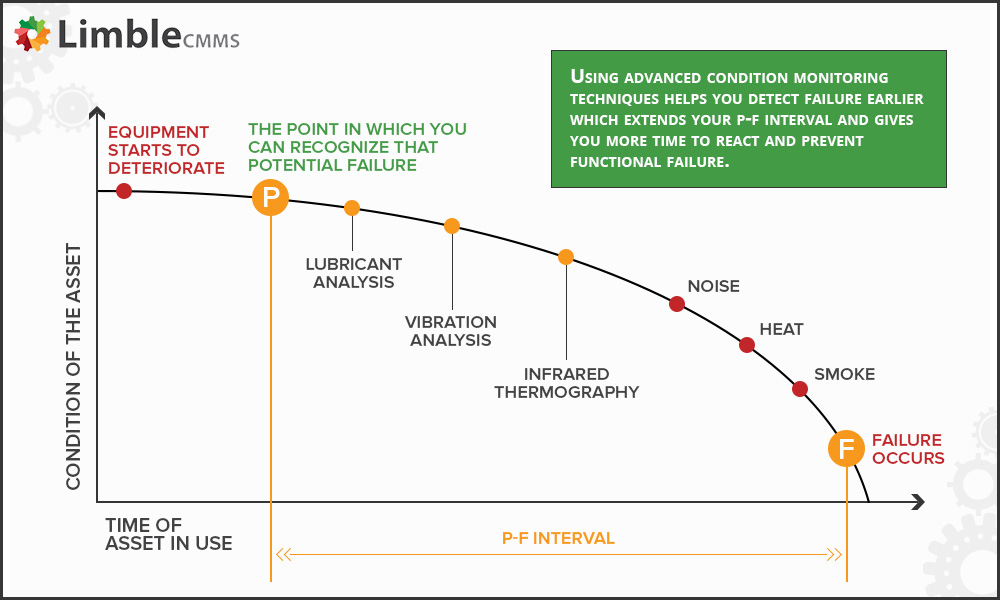
A sample of the P-F curve and the P-F interval
As seen in the image above:
- “P” is the potential failure that represents the point in time when the failure symptoms have started to appear. At this stage, the failure might not occur but the conditions surrounding the equipment will indicate that the failure is bound to happen if the condition persists.
- The point “F” represents the point in time when the asset reaches functional failure, not necessarily a complete breakdown. This matters because functional failure can happen even before you notice audible noise or smoke.
- The P-F interval, therefore, is the time interval between those two points.
Here’s a quick example.
One of the dominant causes of electric motor failure is the seizure of motor bearing. Long before the motor fails due to this failure mode, the symptoms would occur in bearing such as high noise and vibration, indicating an abnormality in motor operation.
During high noise in the bearing, the motor may still continue to operate within required parameters. However, if left unaddressed, its health will start to deteriorate at a faster rate until the motor completely breaks down. In this scenario, the point when the operator first recognizes the abnormal sound is the potential failure (P) and when the bearing is seized is the functional failure (F) of the motor.
Extending the P-F interval
From the context of maintenance planning, the objective is to maximize the P-F interval such that sufficient time is granted to perform necessary corrective action to prevent functional failure.
The effective strategy to prolong the P-F interval should be to incorporate a mechanism that catches the potential failure in a timely manner. The effectiveness of catching a potential failure of any equipment depends upon the nature of the selected maintenance program.
For example, in reactive maintenance, the equipment is attended to only when there is an actual failure. In this case, the P-F interval is effectively zero as there is no method to track failure symptoms.
Similarly, fixed-interval maintenance is also not an effective way to track potential failure since the equipment’s health does not deteriorate consistently over time. There is always a possibility that a potential failure may occur soon after the periodic visual inspection has been completed.
The condition of the equipment is typically an indicator of potential failure that may arise. By accurately measuring and collecting the data on the condition parameters, the failure can be predicted well in advance, prolonging the P-F interval.
One of the most effective mechanisms to track potential failure or Point P in a P-F curve is through condition-based maintenance (CBM).
CBM provides real-time situational awareness that progressively tracks the changing patterns in condition parameters and alerts maintenance staff about an underlying deterioration in the equipment. It involves measuring the actual condition of the equipment (often through various non-destructive testing methods) and adjusting the maintenance schedule accordingly.
In other words, through CBM, the point “P” can be detected much earlier, providing more time to schedule maintenance work and allocate the necessary resources.
Specific variations that P-F curve doesn’t account for
While the P-F curve tells the time of intervention based on the statistical deterioration of equipment health over time, other factors can cause further variations among the equipment failure modes. We discuss the most common ones below.
The impact of design strategy
In some specific applications, the equipment may have fault-tolerant designs that provide greater tolerance to specific faults for longer periods. These types of equipment may also have redundancies that provide added time for an operator to intervene as the redundant equipment can pick up the slack if the primary equipment fails.
For instance, consider a system of two pump motors that are actively redundant to each other. The P-F interval for the entire system of two motors will begin when the primary motor starts showing signs of degradation. However, since there is a secondary redundant motor to take up the load, the effective P-F interval for the entire system is almost doubled.
In this case, the P-F interval for the system can be stretched from the point when the potential failure shows up in the primary motor up until the point when the actual functional failures occur in the secondary motor.
The impact of the operating environment
The operating environment of the equipment also has a significant influence on the way the P-F interval is reviewed.
Some equipment, when loaded differently, may result in different rates of deterioration. Furthermore, certain operating scenarios may require assets to switch on and off more frequently and undergo intermittent overloading.
These operating variances may impact asset health in the long term and need to be accounted for while defining maintenance frequency.
The impact of manufacturing deviation
Manufacturing deviation can be caused by equipment, raw materials, human actions, environment, and methods. This has a significant impact on the P-F interval.
There may be a difference in the quality of raw materials from the same supplier, which may fall under the limits but can cause manufacturing deviation.
The same category of equipment from the same manufacturer can behave differently in production environments which leads to calibration errors.
Condition-based maintenance can prove to be useful in this scenario as it can detect potential failure based on the actual state of health or condition of the equipment.
In contrast, the fixed time-based maintenance will consider the same strategy for the same equipment class and will therefore overlook the underlying manufacturing deviation factors that can also trigger potential failures.
The impact of the environmental conditions
The environment under which equipment operates may also alter the P-F interval.
Equipment is generally designed to operate at specific temperatures and humidity. When any equipment is designed for cold and dry environments, its performance may degrade when subjected to hot and humid environments.
These variations of the environment thus have the capability to change the health and life span of the equipment. This phenomenon may also shrink or expand the gap between P and F points as the equipment may get exposed to a lesser or harsher environment and may need varying maintenance requirements.
Using IoT technology to move to the I-P interval
The Internet of Things (IoT) has been one of the significant developments in the field of advanced analytics and reliability engineering. The networks of sensors are now able to track and communicate equipment health data in real-time.
The collected data is often stored on the cloud and is integratable with modern CMMS systems. CMMS can use the available information to generate alerts and initiate work orders.
Unlike CBM, which deals primarily with real-time data and periodic measurements to catch potential failures, predictive maintenance can leverage maintenance history within CMMS to predict potential failures. Due to the presence of historical information, the pertinent algorithms can be trained to predict failure well ahead of even occurrence of potential failures.
In essence, this indicates a transition from a traditional P-F interval to an I-P interval where the term “I” represents the point of time when the equipment is first installed.
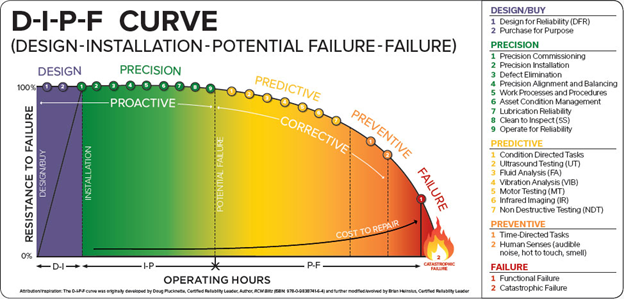
I-P and P-F reliability curve
The underlying concept behind using the I-P interval is that the equipment health data can be collected right from the time when the equipment is installed. The operators should not wait until the occurrence of potential failures to act.
Catching early deterioration signs with CBM technology is great. However, you are still reacting – performing corrective maintenance to address the identified issues.
For world-class asset management, you want to create an environment that will maximize asset reliability and extend its useful life. In other words, you want to maximize the time between serious corrective actions.
This requires proactive measures like checking that the asset is installed properly, that operators know how to use the new machinery, that routine actions like cleaning and lubrication are already on your maintenance schedule, and similar.
More data equals better schedules
As we move forward, having access to enough data is the main prerequisite for building more efficient maintenance schedules.
That being said, you still need to be able to identify common failure modes you want to track. You can use the existing maintenance data to perform RCA and FMEA to find and select failure modes worth tracking.
Based on that, you want to develop preventive measures to prevent those failure modes. Alternatively, you can use condition monitoring technology to catch deterioration signs as early as possible – leaving you with enough time to allocate tools, parts, and labor needed to execute corrective actions before the asset experiences functional failure.
None of this is simple to do, but that is the nature of equipment reliability.

Very nicely, thanks