Fault Tree Analysis (FTA)
Everything you ever needed to know about fault tree analysis.
What is Fault Tree Analysis?
Fault Tree Analysis (FTA) is a tool to analyze the potential for system or machine failure by graphically and mathematically representing the system itself. It is a top-down approach that reverse-engineers the root causes of a potential failure through the root cause analysis process.
In other words, if you ask yourself, “how likely is it that this machine will break down,” Fault Tree Analysis will help you answer that question.
FTA replicates how failure moves through a system. It creates a graphical model of how component failures lead to system-wide failures. These models help reliability engineers create well-defined systems with the proper redundancies that prevent component failures from cascading into system-wide failures – in other words, create more fault-tolerant systems.
Even if the process sounds like rocket science, the terms used in FTA are pretty straightforward.
The analytical graphs used to model FTA’s look like trees, so (unsurprisingly) they are called fault trees. The fault tree diagram will help you understand how one or more small failure events lead to a catastrophic failure. This will help you choose the right corrective and preventive measures in the future.
Table of Contents
When to use Fault Tree Analysis
Who uses FTA and why?
Why Fault Tree Analysis is worth the effort
Fault Tree Analysis symbols and structure
Types of Fault Tree Analysis
Fault Tree Analysis examples
Fault Tree Analysis compared to other analytical methods
Streamlining the process with FTA software
Key takeaway
When to use Fault Tree Analysis
Fault tree analysis can be done at the time of design of the system or during operation (to anticipate potential failures and take preventive actions). The goal is to boost the subsystems and components that are highly likely to fail or cause a major incident before it actually happens.
It can be implemented alone or as a complement to FMEA analysis.
Who uses FTA and why?
In general, fault tree analysis helps prevent future failures and identify critical areas of concern for new workflows, products, and services. That is why various industries use FTA as a method for safety analysis and risk mitigation like:
- Aerospace, aeronautical, and defense operations
- Power generation and system safety
- Cybersecurity system analysis
- Specialty chemical manufacturing
- Healthcare and pharmaceuticals
- Environmental study and disaster management
Notice a theme here? These are industries that could have significant impacts on people’s lives if something goes wrong. When a plane goes down, or a healthcare device doesn’t work as it should, the risk of lives lost or other tragic events is high. FTA is what those industries use to keep those high-risk activities safe.
Why Fault Tree Analysis is worth the effort
FTA can be a technical topic with a lot of math and problem-solving. But there are some outstanding benefits to getting to know it and putting it to work in your business. It:
- Assists in analyzing, understanding, and improving your systems
- Lets you address one fault at a time in a very systematic way
- Runs an assessment of several systems and their relationship with one another
- Focuses on the root cause of the failure, not just the repair
- Prioritizes your repairs based on failure rates and issues that lead to catastrophic failures
- Helps design and plan maintenance in line with the failure probability of each system
- Takes human error into account
With all of these benefits, it just makes sense to bring FTA into your analysis toolbox. With it, you have the power to see the future and predict things.
Fault Tree Analysis symbols and structure
FTA is performed by building fault trees. Fault trees have a standard set of symbols and naming rules used across plants and industries.
The fault tree is a directed acyclic graph (DAG) (meaning, you will read it in one direction from start to finish) which shows the flow and relationship between a series of activities. The activities are categorized as either events or gates.
Event symbols
Events happen in a system or process and can cause or contribute to a failure, such as the breakdown of an individual component. We’ve described events that come up in fault trees below. Event symbols will have only one input and one output.
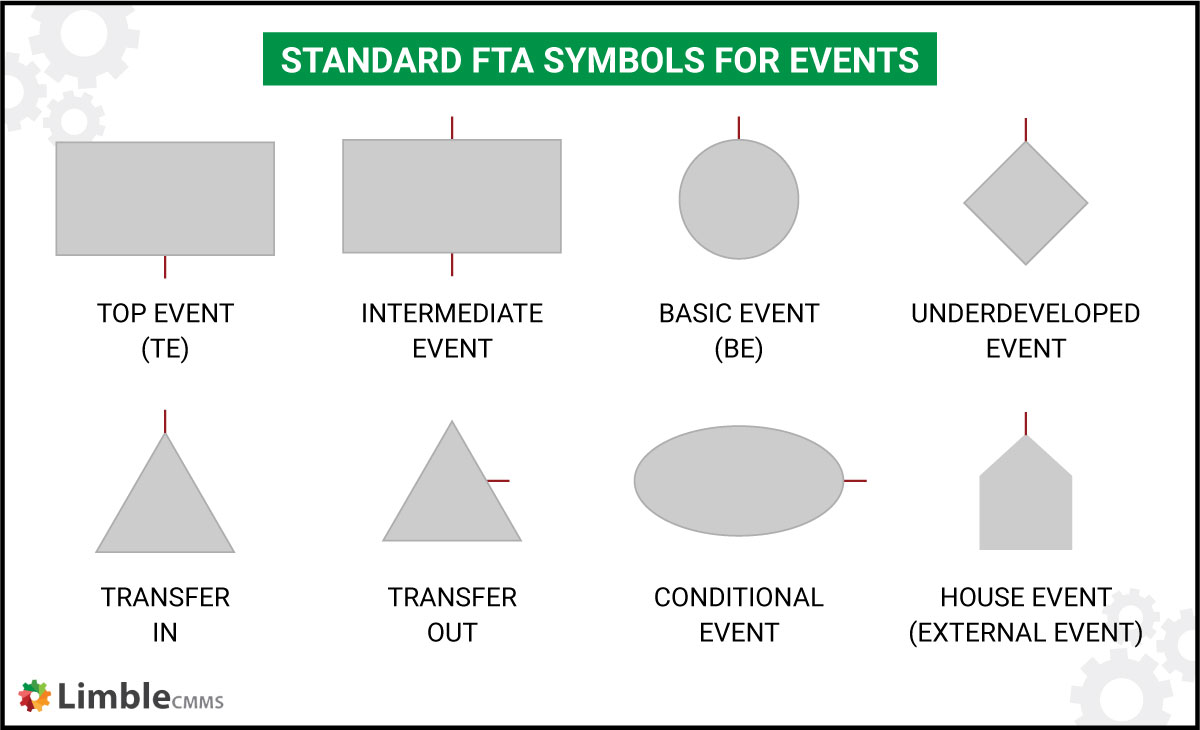
Here’s a short description of the meaning of each event
- Top event (TE): This is the event at the top of the fault tree and is the subject of the analysis. It is often the catastrophic event that causes a system-wide outage. A rectangle represents the top event. It has an input but no output because it is the ultimate culmination or end of the series of events in the tree.
- Basic events (BE): Represents root cause events that spread up the chain of the system to cause the top event. The BE is represented by a circle that does not have any input. This is the opposite and is at the other end of the fault tree from the top event.
- Intermediate events: These are the events caused by one or more other events. BEs cause intermediate events, which eventually cause TE. Intermediate events are represented by rectangles that have both an input and an output.
- Transfer events: A transfer event can be created when a fault tree is too large to fit in a paper. This way, we can replace one big part of the fault tree with a single symbol and elaborate on what comes next on a separate diagram. Triangles represent transfer events. The transfer-out event will have a triangle with output to the right of the triangle. Transfer events will have input to the top top of the triangle.
- Underdeveloped events: Sometimes, events happen that are not basic, but there is not enough information to develop a subtree. These events are marked as underdeveloped events. Undeveloped events are represented by the diamond or rhombus symbol.
- Conditional events: Conditional events are the ones that act as a condition for an INHIBIT gate which is mentioned later. An oval symbol represents conditional events.
- House events: An external event that is normally expected to occur. These events can either happen or not happen, so they carry the probability of 1 or 0, respectively.
Gate symbols
Gates, sometimes called logic gates, represent how failures spread through the system. Occasionally, a single event can result in a top-level event (i.e., catastrophic failure). Other times, a combination of two or more different events can cause the top event. This is where the concept of boolean logic comes in.
Gates represent the boolean logic operators (AND, OR, UNION, NOT, etc.) and show how events combine to cause failure. Each gate will have only one output event but can have one or more input events.
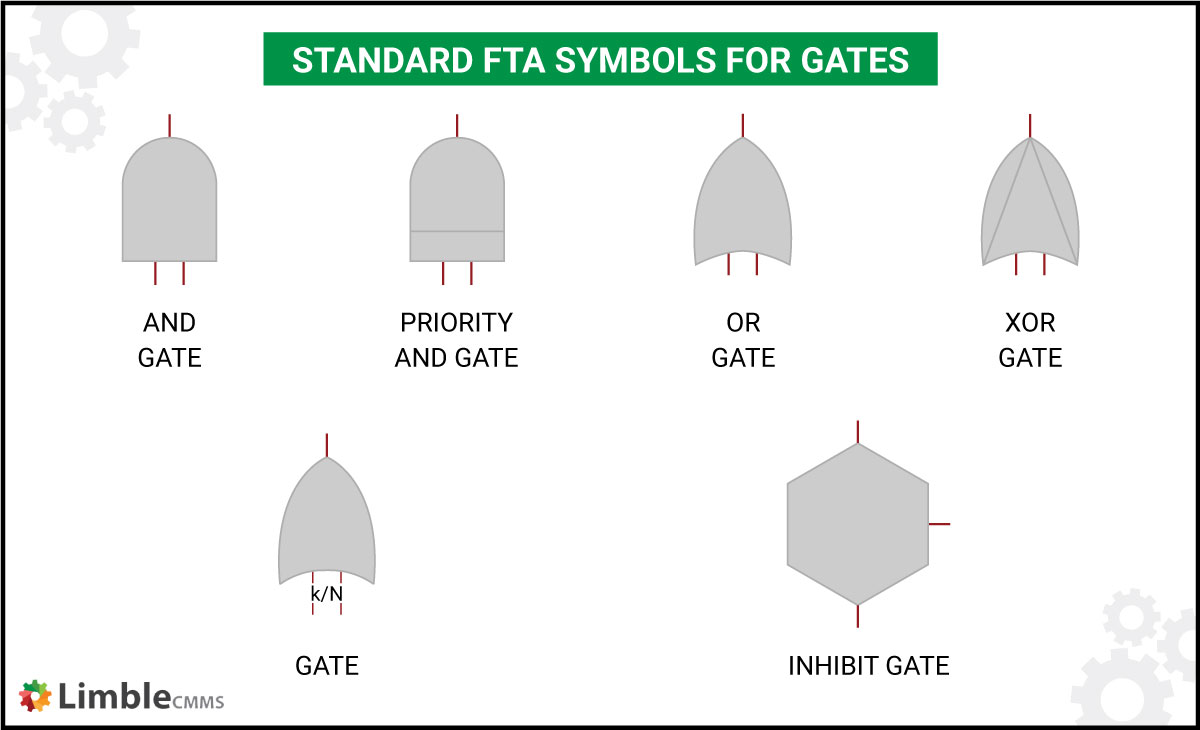
The most used gates in drawing fault trees are described below:
- AND gate: This gate can have any number of input events. The output event it is connected to will only occur if all the input events happen. AND gate has a rounded top out of which comes the output, as shown in the image.
- Priority AND gate: An output event will only occur if all input events happen in a specific sequence. It looks very similar to AND gates, just with an added line at the bottom.
- OR gate: An output event will occur if any one or more of the input events occur. The symbol for the OR gate will have a pointed top end, where the output emerges. The other end is curved and is connected to the inputs, looking somewhat like a rocket.
- XOR gate: An output will occur only if exactly one input element occurs. It would look like if you tried to draw in a triangle inside the standard OR gate.
- k/N or VOTING gate: For this gate, there will be an ‘N’ number of input events and one output event. The output event will occur if ‘k’ number of input events occurs. It looks similar to the OR gate with a ‘k/N’ written at the bottom end.
- INHIBIT gate: Similar to AND gate, an output event will occur when input events occur, and a conditional event also occurs. The symbol for the INHIBIT gate is a hexagon. The input event is connected directly below the gate, and the conditional event is connected to the right of the gate. At the top is the output like in all other symbols.
Types of Fault Tree Analysis
Standard Fault Tree Analysis isn’t the only method available. Other extensions of FTA have been developed for specific use cases and industries. The extensions would be capable of visualizing features that are not easily expressed by standard fault trees. Some of them are:
- Dynamic FTA: Dynamic Fault Trees (DFT) extend standard fault trees by modeling complex system components’ behaviors and interactions.
- Repairable FTA: Repairable Fault Trees (RFT) enhance the FTA model by introducing the possibility to describe complex dependent repairs of system components.
- Extended FTA: Takes multi-state components and random probabilities into consideration.
- Fuzzy FTA: Takes unreliable factors that are difficult to predict (like the wind or weather) into account with a complex mathematical concept called fuzzy set theory.
- State-event FTA: SEFT Is used to analyze dynamic behavior that ordinary fault trees cannot model.
Generally speaking, FTAs fall into two categories; qualitative and quantitative.
Qualitative analysis is performed every time, while quantitative analysis can be done as an add-on in situations when you know the probabilities of the events in your fault tree. Let’s take a deeper look at each of them.
Qualitative FTA
Qualitative FTA is used to gain insight into the structure of fault trees to analyze the vulnerabilities of a system. There are many different ways to conduct qualitative fault tree analysis, such as:
- Minimal cut sets (MCS) help identify the vulnerabilities of a system. If an FT contains a small number of components or a set of elements with a high likelihood of failure, the system would be deemed unreliable. MCS identifies these sets of elements in a fault tree. If you can reduce the probability of failure of some components or add redundancies, you will improve the system’s reliability.
- Minimal path sets (MPS) will help you determine the robustness of a system. It tries to identify the minimum set of components that can keep the system functional. After those elements are identified, you can spend time working to lower the chance of them failing. This increases the overall reliability of the system.
- Common cause failures (CCF) determine if multiple failures can be caused by a single element. The components identified through CCF are considered critical components. Your team needs to make sure these components are routinely inspected and replaced (as necessary). A computerized maintenance management system (CMMS) like Limble can plan and schedule maintenance of these critical components.
Quantitative FTA
Quantitative FTA can be used to calculate the actual probability of the failure you are analyzing. Assigning that numerical probability of failure will help you better understand and prioritize your risk.
The result of quantitative FTA can be in the form of stochastic or importance measures:
- Stochastic measures give you the probability of failure for the system.
- Importance measures assign the level of importance that a cut set or path is to the reliability of the whole system.
When you know the probability of your basic events, you can easily calculate the probabilities of your intermediate events based on the gates that connect them. The most common gates are AND gates and OR gates. Here’s a simple example.
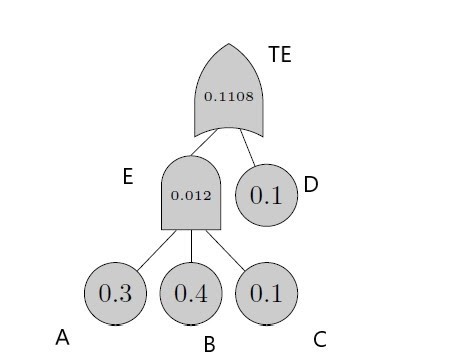
An example of quantitative FTA method
Here, A, B, C, and D are basic events. E is an intermediate event and TE is the top event. The intermediate event E is connected to the basic events A, B, and C using an AND gate. A, B, and C have to fail for the intermediate event E to happen. The probabilities of failure for A, B, and C are known. Therefore:
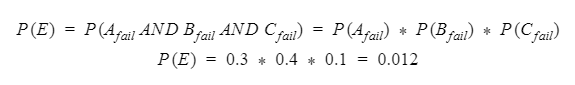 The top event failure TE is reached by connecting E and D through an OR gate. E in itself is a failure event and the probability of occurrence of the basic event D is known.
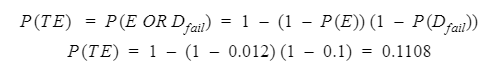
The probability of top event failures can be calculated like this using the qualitative FTA method.
Checklist for Creating a Preventive Maintenance Plan
Following a consistent Preventive Maintenance Plan can make life easier. Use this checklist to create your own!

Fault Tree Analysis examples
Here are two different examples of Fault Tree Analysis to help paint the picture of how the process works.
The car won’t start
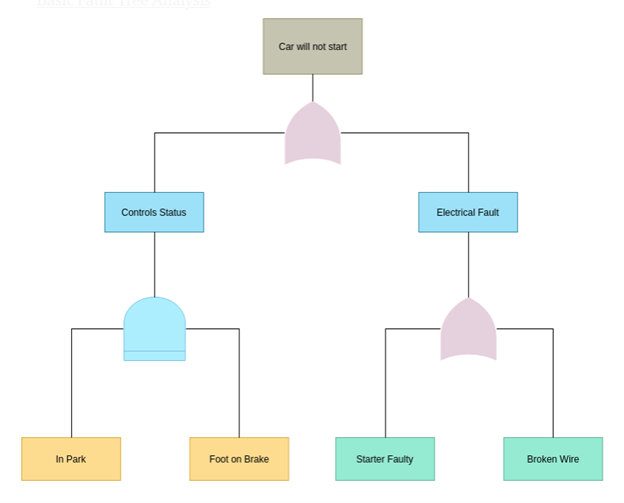
FTA example for a car that will not start
*The explanation we give below doesn’t directly match the FTA shown above. We wanted to give a more practical explanation than “remove your foot from the brake” to start the car 🙂
You wake up one morning and get ready for work. You hop into your car, turn the key, and — nothing. Your car won’t start. It’s not even turning over.
Knowing a thing or two about cars, you hop out, pop the hood and check the battery. Next, you check the gas gauge to make sure you are not out of gas before getting back into the car to ensure that the lights were not left on overnight.
In this example, the car not starting is the failure or Top Event (TE). The three options as to why the car won’t start are all connected by an OR gate, meaning any one or a combination of the three could cause the vehicle not to start.
Taking it one step further, when you check the battery, you have a few things that could cause the failure. The battery is old and needs to be replaced, or the battery is flat and needs a jump. The next question to ask would be why the battery is flat. If the headlights were left on, your next task is to determine how to avoid that in the future? Make sure to check them before getting out of the car.
Suppose you want to calculate the probability of failure. In that case, you need to assign a number representing the probability of occurrence to the events and then use the qualitative FTA method to calculate the top event failure.
Server experiences a catastrophic failure
This example is more technical than the last one. Let’s say you have a server that stores critical data, and it experiences a catastrophic failure.
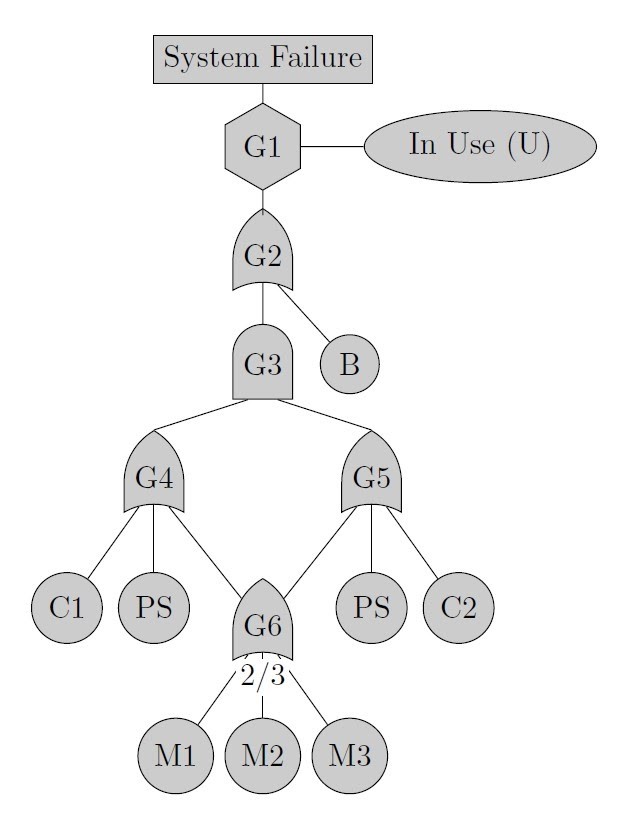
Fault Tree Analysis example for a server failure
Here are quick explanations for certain elements:
- B is a non-redundant system bus.
- PS is the power supply to the server.
- C1 and C2 are two redundant central processing units (CPUs) for the server, meaning one of the two CPUs can fail without causing total system failure.
- M1, M2, and M3 are memory components that can be shared between both CPUs.
This fault tree maps out the path, cut sets, and probabilities of the top event (system failure) happening.
Failure spreads from the basic events to the top event through the gates G1 – G6. Gate G1 is an INHIBIT gate with the condition that the system failure will happen only when the system is in use. This means that faults can be repaired during scheduled downtime allocated for maintenance. Gate G2 indicates that failure of either basic event B or the failure of the sub-system propagated till G3. Gate G3 fails only when both the CPU subsystems (with C1 and C2) fail.
Each CPU subsystem consists of the power supply (PS), CPU (C1 or C2), and memory component propagated through G6. Each CPU subsystem will fail if either the power supply, CPUs, or the memory component fails. Failure at a level above will happen only if both the CPU subsystems fail. G6 is a voting gate, and for failure to propagate, at least two of the three memory components must fail.
The boolean expressions for the system are as below (the ∩ stands for the boolean operator “union,” which is basically where the two components function joins or overlaps):
- G1 = U ∩ G2
- G2 = B ∩ G3
Combining the two gets us:
- G1 = U ∩ (B ∩ G3)
- G1 = (U ∩ B) ∪ (U ∩ G3)
You can continue in this manner until all the intermediate events are eliminated, and only basic events remain to get you to the minimal cut sets. This is the top-down approach.
Since the probabilities of the basic events are not stated, you can’t perform a quantitative analysis.
If we didn’t satisfy your cravings for logic gates and diagrams, you can find a bunch of additional FTA examples here.
Fault Tree Analysis compared to other analytical methods
FTA is not the only analytical methodology out there. Let’s take a look at a few others to see how they compare.
FMEA
While FTA uses a top-down method to assess points of failure, Failure Modes and Effect Analysis or FMEA uses a bottom-up approach. It questions what could go wrong at each step that may cause failure instead of looking at the failure first.
Also, FMEA does not look at the relationship between different events or conditional events the way FTA does. Therefore, FTA is a more complex but thorough analysis.
FMECA
Failure mode effects and criticality analysis (FMECA) is easy to grasp. It is like FMEA, but it adds a criticality analysis or ranked list. FMEA looks at a long list of “what-if’s” FMECA allows you to rank failures so you can better plan and prioritize your work.
ETA
Event tree analysis focuses on specific questions and answering them in a very straightforward way. Moreover, it doesn’t have the general use that fault tree analysis does. It is generally used in financial industries.
Everything you ever wanted to know about FMEA, FMECA, and more >
Streamlining the process with FTA software
FTA for large and complex systems can quickly become so large that they can’t be drawn on a single page or a whiteboard. You can work around this by using tried and true transfer elements. However, even with them, the diagram can become too large to handle, read, and comprehend. Fault tree analysis software is an excellent solution for this type of problem.
In addition to simplifying graphical representation, some applications have algorithms that can automatically identify quantitative aspects of FTA like MCS, MPS, and CCF. If you know your probability of failure for your basic events, the probabilities for top events and subsystem failures can be calculated with the click of a button.
Here are a few systems you can try out:
- Visual paradigm: Feature-rich FTA software with a free trial.
- Blocksim: FTA software that is a part of a suite of reliability software applications from ReliaSoft.
- ALD fault tree analyzer: A free cloud-based FTA software.
Those are by no means all available solutions, just the more popular ones. There are many out there with additional features suited to different uses. Shop around to find the right product for you based on your specific purpose and industry.
Additional resources
As you can tell, a lot of research and expertise has gone into developing the Fault Tree Analysis process. If you would like to dive deeper into this subject, check out these additional resources:
- Book: Fault Tree Analysis Primer by Clifton A Ericson II
- Book: Fault Tree Analysis A Complete Guide by Gerardus Blokdyk
- Coursera lecture on FTA
- FTA lecture on YouTube by Department of Industrial Ans Systems Engineering at IIT Kharagpur
Another FTA lecture on Youtube by xSeriCon, an engineering consultancy and safety training firm.
Want to see Limble in action? Get started for free today!
Wrapping it up
Fault Tree Analysis can certainly be complex. If you get the right team together and practice it enough, you’ll start to feel that you can look into the future and anticipate failures and their causes. You’ll be the wizard that plans fault repair into scheduled maintenance downtime and keeps your team working proactively more than they work reactively.
At Limble, we’re here to support you every step of the way. Our CMMS system will house all of the information you and your team need to effectively build FTA’s, manage activities to mitigate risk, and so much more. It’s our mission to make your job as easy and streamlined as possible. Reach out to us with questions or to see how our CMMS can support you.


